AI Raises Prices Without Colluding, Just by Changing the Screen AI는 담합하지 않고도 같은 화면에서 다른 가격을 만든다
Qiu et al. (2025) · Marketing Science | Kravitz (2025) · Consumer ReportsQiu et al. (2025) · Marketing Science | Kravitz (2025) · Consumer Reports
📌 Ranking One Product Higher Was Enough — AI Raised Prices Without Colluding
Liying Qiu, Yan Huang, Param Vir Singh, Kannan Srinivasan (2025) Personalization, Consumer Search, and Algorithmic Pricing. Marketing Science 44(6):1278–1298.
✔️ Introduction and Summary
Hand pricing decisions to AI, and sellers can end up settling on prices above the competitive market rate — without ever coordinating with one another. What happens when this “algorithmic collusion” gets tangled up with how a platform recommends products? A new study finds that personalization — the very feature designed to show you products that fit you — may itself be pushing prices higher. Researchers at Carnegie Mellon’s Tepper School of Business confirmed this through simulation. Under “personalized ranking,” where products are tailored to each individual, the prices AI pricing algorithms converged on came out 29% higher than under “non-personalized ranking,” where every consumer sees the same order. Consumer surplus fell by 13% in the opposite direction.
There was no price discrimination. Every consumer was shown the same price — that’s what makes this notable. And yet consumers still lost out. The paper’s central claim is that this all comes down to a single difference: the order in which products are displayed.
✔️ Research Content and Logic
There’s already a body of research showing that reinforcement-learning-based pricing algorithms converge on high prices as an outcome, even without any intent to collude. Calvano et al. (2020), published in the American Economic Review, is the best-known example. They attached independent Q-learning algorithms to competing sellers and had them repeatedly compete on price, finding that even without coordinating, the algorithms settled on prices above the competitive equilibrium. But these earlier studies assume consumers compare every product at a glance — a poor match for how people actually shop. Consumers look at products one at a time, in some order, and it’s the platform that decides that order. This paper’s focus is exactly that order: the ranking.
The satisfaction (utility) a consumer feels from viewing a single product can be written as follows.
The satisfaction consumer i gets from product j is the product’s quality (aj), minus an amount that scales with how sensitive the consumer is to price (φpj), plus a value reflecting how well the product matches individual taste (μεij). Quality and price are visible right on the ranking screen, but how well something fits requires opening the product page to find out.
Opening products one by one, though, comes at a cost. The cumulative search cost a consumer incurs after examining up to the r-th product is given by the formula below: viewing the first product is free, but from the second product onward, each additional product opened adds a cost of ρ.
Following Weitzman’s (1979, Optimal Search for the Best Alternative, Econometrica) sequential search theory, consumers weigh this cost against the expected gain from looking further to decide whether to stop here or keep browsing.
What a consumer ultimately nets is consumer surplus — utility minus search cost.
Consumer surplus is the utility from the best product chosen after searching up to the r-th product (max(Sui)), minus the search cost incurred getting there (ζ(ri)). If utility is “the satisfaction from a single product,” consumer surplus is closer to “the net gain from the entire shopping trip, search included.”
Sellers, meanwhile, are watching each other to set prices. Each seller keeps learning its next price through trial and error via a Q-learning algorithm, based on what its rival charged last time. Two AIs can arrive at a tacit equilibrium of “let’s hold this price,” and one can also quietly undercut it and break that equilibrium. How well this equilibrium holds ultimately depends on the ranking method.
Under personalized ranking, the product a consumer wants is already sitting at #1, so there’s no reason to look further. In that state, if a seller shaves the price down slightly, the only consumers who’d even notice the ranking shift are the small sliver who were on the fence to begin with. Under non-personalized ranking, by contrast, everyone sees the same order. If a seller cuts price and grabs the #1 spot, that effect hits every consumer simultaneously. The authors call this difference the “ranking-mediated price elasticity of demand.” The larger this elasticity, the more an AI stands to gain by cutting price — and so the high-price equilibrium that would otherwise emerge spontaneously, without any explicit coordination, becomes harder to sustain.
✔️ Data and Methodology
This paper derives its results by running repeated computer simulations of the model above. The baseline market structure has two sellers of differing quality competing, with a version extended to three sellers run alongside it.
The parameters in the utility equation above were fixed as follows: price sensitivity φ and taste-difference weight μ were each set to 1.0, and quality (aj) was set to 4.0 for the low-quality seller and 4.5 for the high-quality seller. Search cost was fixed at ρ = 1.5, a value that corresponds to 41–53% of the price AI converged on — in line with the range existing empirical studies have estimated (8.5–64% of price). These figures are parameters the researchers chose for the simulation, not data observed in an actual market.
Each scenario was run 100 times until the AI algorithms stopped changing prices (equilibrium), and the average over the final 1,000 iterations was compared. The authors also confirmed statistically that the gap between personalized and non-personalized ranking wasn’t due to chance.
They additionally checked the following conditions: increasing the number of sellers, varying the algorithm’s learning speed, using AI approaches other than Q-learning, dialing personalized-ranking accuracy down from perfect to random, changing the ranking criterion, and varying search cost and the value of the outside option — seven extensions in total.
✔️ Findings
In the baseline scenario, the average price AI converged on was 2.84 under non-personalized ranking and 3.67 under personalized ranking — a 29% gap. Under non-personalized ranking, the competitive prices for the low- and high-quality sellers were 1.02 and 2.78 respectively, and the prices AI reached were far above even these. Seller profits differed by 74% (0.54 vs. 0.94), and consumer surplus was 13% lower under personalized ranking (2.43 vs. 2.10).
To see why this gap emerges, the authors simulated a scenario where one seller briefly cuts price before returning to the original level. Under personalized ranking, price returned to its original level after 5 rounds; under non-personalized ranking, it took 10. In other words, sustaining a high price under non-personalized ranking requires AI to learn a more complex, longer-running “retaliation” strategy.
The most striking result compares how much the ranking shifts when a single price changes. Under personalized ranking, when the high-quality seller cuts price by 0.1, the probability of ranking #1 barely moves — from 49.8% to 52.2% — and demand ticks up only slightly, from 0.389 to 0.413. Under non-personalized ranking, the very same 0.1 price cut sends the probability of ranking #1 from 0% to 100%, and demand jumps from 0.02 to 0.653. A mere ten-cent difference flips a product from dead last to first place.
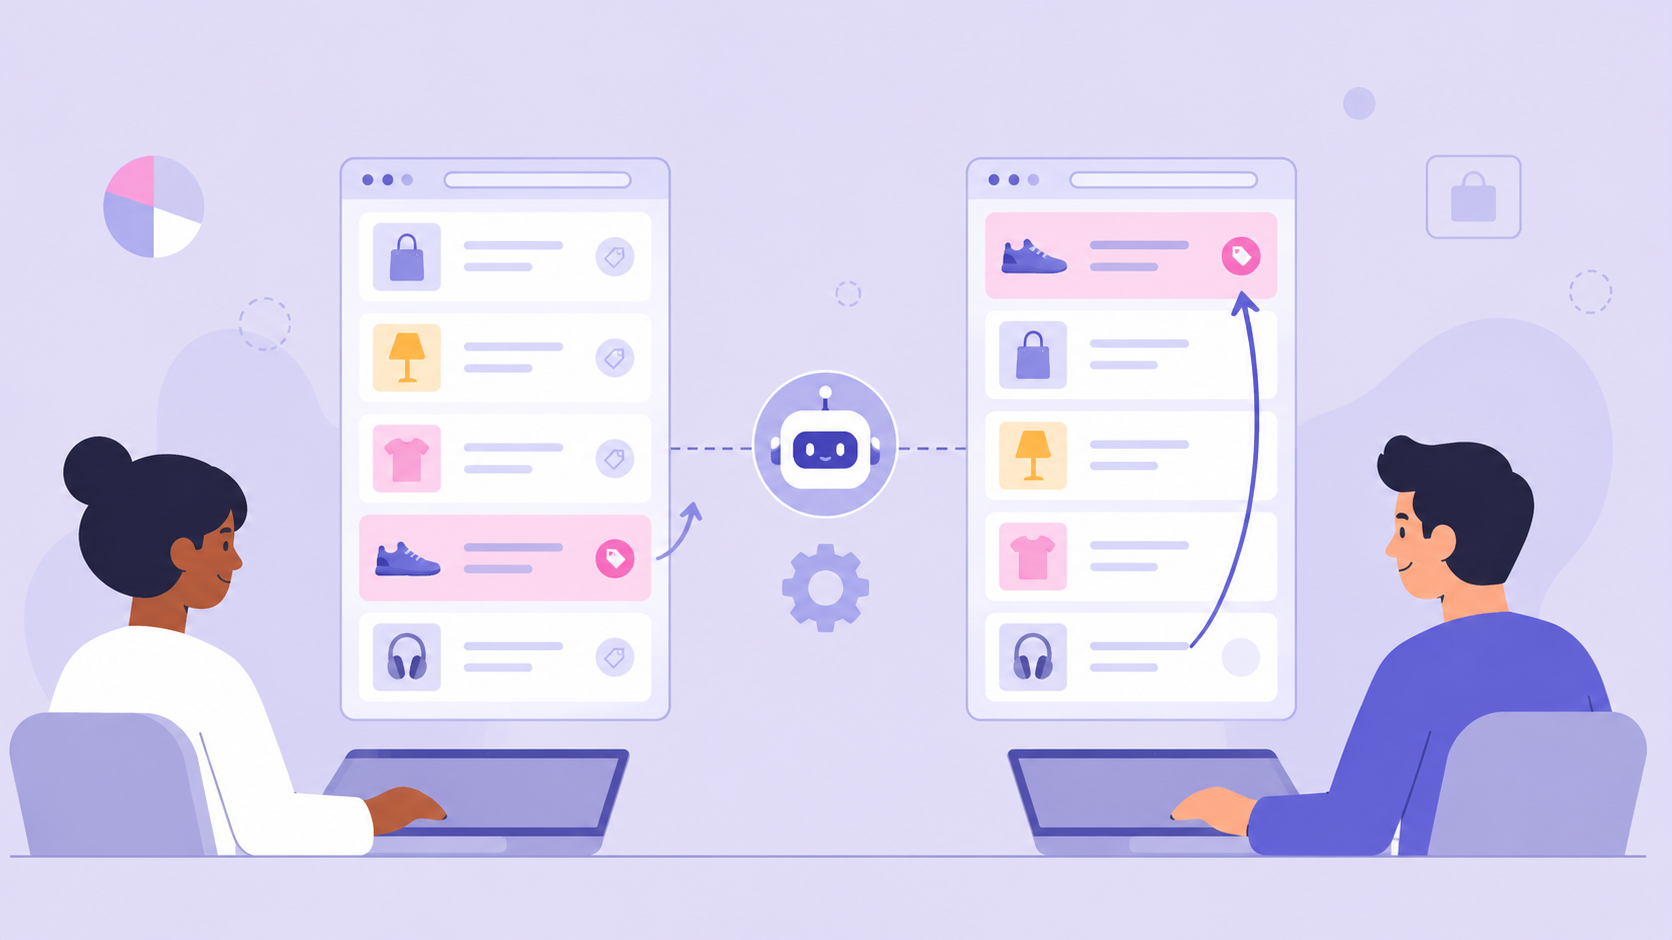
Figure 1. Under personalized ranking (left), cutting price barely moves the ranking; under non-personalized ranking (right), the ranking swings wildly. This gap is what undermines AI’s collusive high-price equilibrium. (Illustrative image, not an original figure from the paper.)
This direction held up across most other conditions, with one exception: when personalized-ranking accuracy was degraded, prices themselves barely changed, but consumer surplus fell even further. The less accurate the personalization, the more effort consumers had to spend searching again. Poorly executed personalization, it turns out, manages to combine the downsides of both worlds.
✔️ Conclusion
This paper’s contribution is to widen the landscape of collusion research by one notch. Existing work has mostly focused on how AI colludes and what rules might prevent it. This paper instead brings in a new variable — the platform’s ranking method. If the pricing algorithm itself is hard to regulate, simply changing the order in which a platform displays products can still curb collusion.
It also connects to the broader conversation about consumer data. The more data collected to sharpen personalization, the better product matching gets — but at the same time, the more room AI has to push prices up collusively. The familiar idea that “giving more data gets you better service” may not hold, at least on the price dimension.
Because this study rests on simulation rather than real data, whether effects of this magnitude actually show up on real platforms remains to be confirmed — the authors themselves leave this as future work. The Consumer Reports investigation of Instacart, covered next, offers a useful reference point for exactly that question.
✔️ References
- Calvano, E., Calzolari, G., Denicolò, V., & Pastorello, S. (2020). Artificial intelligence, algorithmic pricing, and collusion. American Economic Review, 110(10), 3267–3297. doi.org/10.1257/aer.20190623
- Qiu, L., Huang, Y., Singh, P. V., & Srinivasan, K. (2025). Personalization, consumer search, and algorithmic pricing. Marketing Science, 44(6), 1278–1298. doi.org/10.1287/mksc.2023.0455
- Weitzman, M. L. (1979). Optimal search for the best alternative. Econometrica, 47(3), 641–654.
📌 Same Cart, Different Receipt — Instacart’s AI Pricing Experiment
Kravitz, D. “Instacart’s AI-Enabled Pricing Experiments May Be Inflating Your Grocery Bill.” Consumer Reports (joint investigation with Groundwork Collaborative and More Perfect Union), Dec. 9, 2025 (updated Dec. 22, 2025).
✔️ Introduction and Summary
Same moment, same store, same cart in hand — yet the total on the receipt was different. That’s the finding from an investigation Consumer Reports ran on the Instacart app together with Groundwork Collaborative and More Perfect Union, recruiting real consumers to take part. This kind of price experimentation was happening across major US grocery chains including Albertsons, Costco, Kroger, Safeway, Sprouts, and Target. Per-item price differences ran as high as $2.56, or up to 23% by proportion. After the investigation broke, Instacart — North America’s largest online grocery service — discontinued the pricing-experiment technology it had been offering to retailers.

Figure 2. Same moment, same store, same cart — yet the total on the receipt came out different. (Illustrative image, not an original figure from the report.)
✔️ Investigation Background and Logic
How would anyone even catch a price difference like this? Algorithmic pricing is inherently hard to spot — a consumer only sees the price shown to them, with no way to check what price anyone else is seeing. Consumer Reports solved this with an experiment: get multiple people to log in to the same store at the same time and fill identical carts, so they could compare prices they would otherwise each have seen alone and never questioned.
What made this pricing experimentation possible was Eversight, an AI pricing startup Instacart acquired in 2022. Since the acquisition, Instacart has offered retailers price-optimization software that it says can lift revenue by 1–3% and profit by 2–5%. Instacart’s own position was that these pricing experiments have a negligible effect on consumers.
✔️ Data and Investigation Methods
To put this idea into practice, Consumer Reports recruited 437 volunteers nationwide and split them into four groups. Connecting simultaneously over video calls, they filled identical carts of 18–20 items at the same retailers (Safeway, Target); a separate in-person test was run in Washington, D.C. to confirm the results. No actual purchases were made — participants simply screenshotted the prices shown on their own screens for comparison. Of the screenshots collected, about 200 clean ones were analyzed, and in November, four more retailers — Albertsons, Costco, Kroger, and Sprouts — were checked online.
✔️ Investigation Findings
Analysis of the collected screenshots found that roughly three-quarters of the products checked were being sold at different prices to different consumers. In some cases, a single product was sold at up to five different prices. Price differences for the same item ranged from as little as 7 cents to as much as $2.56.
A test at one Seattle Safeway store was especially striking. Thirty-nine participants filled the same 20 items, and their cart totals split into five different amounts, ranging from $114.34 to $123.93 — an 8.4% spread. Only 8% of participants received the lowest price. Converted to Instacart’s own stated average grocery spend for a family of four, a gap like this could translate into a roughly $1,200 annual difference.
How this price gap was actually produced came to light by accident. An email Costco mistakenly forwarded to Consumer Reports referenced the pricing-adjustment method Instacart had been running internally — a machine-learning tool designed to gauge how sensitive shoppers are to price on each product, refine price perception, and boost sales. On top of this, Consumer Reports also confirmed that Instacart had obtained personal data from two major US data brokers.
✔️ Conclusion
What gives this investigation its force isn’t theory or estimation — it’s that it directly showed price differences experienced simultaneously by more than 400 real consumers. Consumers are somewhat used to prices that shift with demand for things like flights or hotels. But finding this kind of variation in something as close to a necessity as groceries lands differently. Indeed, a survey cited in the investigation found that most Instacart users opposed being charged different prices from other people.
This trend is already moving into the regulatory stage. Since last November, New York State has required disclosure to consumers when an algorithm has used personal data to set a price. The US Federal Trade Commission (FTC) issued guidelines in 2022 on unfair pricing based on personal data, and in 2024 demanded records from eight companies offering personalized pricing technology. California, Colorado, Pennsylvania, and other states have related bills in progress as well.
This investigation connects to the concern the Qiu et al. paper covered above raised through simulation — though the mechanism differs. Where the Qiu et al. paper dealt with prices rising through ranking alone, with no price discrimination involved, this investigation is a more direct case of consumers simply being charged outright different prices. The warning common to both cases: the more sophisticated personalization gets, the more room there is for consumers to lose out.
Instacart has stated that this pricing experiment used no individual demographic or personal data, and only randomly tested prices at the product level. If true, that means the current price differences are not, at minimum, personalized discrimination along the lines of “charge the wealthy more.” Consumer Reports likewise found no evidence during its investigation that personal data was actually reflected in prices. Still, patent filings from Instacart describe technology for pricing based on personal data — so while this isn’t happening now, the possibility that it could head in that direction later remains open.
📌 랭킹 하나 바꿨을 뿐인데, AI는 담합 없이 가격을 올렸다
Liying Qiu, Yan Huang, Param Vir Singh, Kannan Srinivasan (2025) Personalization, Consumer Search, and Algorithmic Pricing. Marketing Science 44(6):1278-1298.
✔️ 소개 및 요약
AI에게 가격 결정을 맡기면, 판매자들끼리 서로 짜지 않았는데도 시장 경쟁가보다 높은 가격에서 멈추는 현상이 나타날 수 있다. 이런 “알고리즘 담합”에 플랫폼의 상품 추천 방식까지 얽히면 어떻게 될까. 소비자에게 맞춰 상품을 추천해주는 개인화 기능이 사실은 더 비싼 가격을 물리고 있을 수도 있다는 연구 결과가 나왔다. 카네기멜런대 테퍼경영대학원(Tepper School of Business, Carnegie Mellon University) 연구진이 시뮬레이션으로 이를 확인했다. 소비자 개인에게 맞춘 “개인화 랭킹” 아래에서 AI 가격 알고리즘이 정한 가격은 모두에게 같은 순서를 보여주는 “비개인화 랭킹”보다 29% 높게 나왔다. 소비자잉여는 반대로 13% 줄었다.
가격 차별은 없었다. 모든 소비자에게 같은 가격이 제시됐다는 점이 특징적이다. 그런데도 소비자는 손해를 봤다. 상품이 어떤 순서로 노출되느냐, 이 하나의 차이에서 벌어진 일이라는 게 이 논문의 핵심이다.
✔️ 연구 내용 및 논리
강화학습 기반 가격 알고리즘이 담합할 의도 없이도 결과적으로 높은 가격에 수렴한다는 연구는 이미 여러 편 있다. American Economic Review에 실린 Calvano 외(2020)가 대표적이다. 이들은 경쟁하는 판매자 여러 명에게 각자 독립적인 Q러닝 알고리즘을 붙여 반복적으로 가격을 겨루게 했는데, 서로 짜지 않았는데도 결국 시장 균형가보다 높은 가격에서 멈추는 걸 확인했다. 다만 이 선행 연구들은 소비자가 모든 상품을 한눈에 비교한다고 가정하고 있어서 실제 쇼핑 방식과는 거리가 있다. 소비자는 상품을 하나씩 순서대로 살펴보는데 그 순서를 정하는 게 바로 플랫폼이다. 이 논문이 주목하는 지점이 바로 그 순서, 즉 랭킹이다.
소비자가 상품 하나를 봤을 때 느끼는 만족도(효용)는 다음과 같이 나타낼 수 있다.
소비자 i가 상품 j에서 얻는 만족도는, 그 상품의 품질(aj)에서 가격에 민감하게 반응하는 정도만큼을 빼고(φpj), 나한테 얼마나 잘 맞는지가 취향 차이만큼 반영된 값(μεij)을 더한 것이다. 품질과 가격은 랭킹 화면에서 바로 보이지만, 나한테 잘 맞는지는 상품 페이지를 직접 열어봐야 알 수 있다.
그런데 상품을 하나씩 열어보는 데는 비용이 든다. r번째 상품까지 살펴본 소비자가 치르는 누적 탐색 비용은 다음과 같다.
첫 상품을 볼 때에는 비용이 들지 않지만, 두 번째 상품부터는 하나씩 열어볼 때마다 ρ만큼의 비용이 쌓인다. 소비자는 Weitzman(1979, Optimal Search for the Best Alternative, Econometrica)의 순차 탐색 이론(sequential search theory)에 따라, 이 비용과 “더 볼 때 얻을 수 있는 기대 이득”을 비교해가며 “여기서 멈출지 더 볼지”를 판단한다.
소비자가 최종적으로 얻는 순이익은 효용에서 탐색 비용을 뺀 소비자잉여(consumer surplus)다.
소비자잉여는 소비자가 r번째 상품까지 탐색한 뒤 고른 최선의 상품에서 얻는 효용(max(Sui))에서, 거기까지 도달하는 데 쓴 탐색 비용(ζ(ri))을 뺀 값이다. 효용이 “상품 하나에서 얻는 만족도”라면, 소비자잉여는 “탐색까지 포함한 전체 쇼핑에서 남는 순이익”에 가깝다.
판매자들도 서로 눈치를 보며 가격을 정한다. 각 판매자는 상대방이 지난번에 얼마를 불렀는지 보면서 Q러닝 알고리즘으로 계속 시행착오를 거쳐 다음 가격을 배워나간다. 두 AI가 “이 가격을 유지하자”는 암묵적인 균형에 이르기도 하고, 한쪽이 슬쩍 가격을 내리며 그 균형을 깨기도 한다. 이 균형이 얼마나 잘 유지되는지는 결국 랭킹 방식에 달려 있다.
개인화 랭킹에서는 내가 원하는 상품이 이미 1등으로 떠 있으니 더 찾아볼 이유가 없다. 이 상태에서 판매자가 가격을 살짝 낮춰도 순위가 바뀌는 건 원래 애매하게 고민하던 일부 소비자한테만 해당된다. 반면 비개인화 랭킹에서는 모두가 같은 순위를 본다. 판매자가 가격을 낮춰서 1등을 차지하면 그 효과가 모든 소비자한테 한꺼번에 미친다. 저자들은 이 차이를 “랭킹이 매개하는 가격탄력성(ranking-mediated price elasticity of demand)”이라고 부른다. 이 탄력성이 클수록 AI는 가격을 낮춰서 얻는 게 많아지고, 결국 앞서 본 것처럼 서로 말을 맞추지 않고도 저절로 도달하는 고가격 균형은 유지되기 어려워진다.
✔️ 데이터 및 방법론
이 논문은 위 모델을 컴퓨터로 반복 시뮬레이션해서 결과를 얻은 연구다. 시장은 품질이 다른 두 판매자가 경쟁하는 구조를 기본으로 삼았고 판매자를 3개로 늘린 버전도 함께 돌렸다.
앞서 나온 효용식의 파라미터들은 다음과 같이 고정했다. 가격 민감도 φ와 취향 차이 반영 정도 μ는 각각 1.0으로 두었고, 품질(aj)은 저품질 판매자 4.0, 고품질 판매자 4.5로 설정했다. 탐색 비용은 ρ = 1.5로 고정했는데, 이 값은 AI가 도달한 가격의 41~53% 수준에 해당하며, 기존 실증 연구들이 추정해온 범위(가격의 8.5~64%)와 비슷한 수준이다. 이 숫자들은 시장에서 관찰한 데이터가 아니라 시뮬레이션을 위해 연구자가 정한 파라미터다.
각 상황마다 100번씩 반복 실행해서 AI 알고리즘이 더 이상 가격을 바꾸지 않는 지점(균형)에 도달할 때까지 지켜봤고, 마지막 1,000회 반복 구간의 평균값을 비교했다. 개인화와 비개인화 사이의 차이가 우연이 아니라는 것도 통계적으로 확인했다.
이 밖에 다음과 같은 조건들도 함께 확인했다. 판매자 수를 늘려보고, 알고리즘이 학습하는 속도를 바꿔보고, Q러닝이 아닌 다른 방식의 AI도 써보고, 개인화 랭킹이 얼마나 정확한지를 완벽한 수준부터 무작위 수준까지 낮춰보고, 랭킹 기준을 다르게 바꿔보고, 탐색 비용과 외부재의 가치를 다르게 설정해보는 식으로 총 일곱 가지 확장 분석을 진행했다.
✔️ 연구 결과
기본 시나리오에서 AI가 도달한 평균 가격은 비개인화 랭킹에서 2.84, 개인화 랭킹에서 3.67이었다. 29% 차이다. 비개인화 랭킹에서 저품질·고품질 판매자의 경쟁가는 각각 1.02, 2.78인데, AI가 도달한 가격은 이보다 훨씬 높다. 판매자 이익은 0.54와 0.94로 74% 차이가 났고 소비자잉여는 2.43과 2.10으로 개인화 랭킹 쪽이 13% 낮았다.
저자들은 왜 이런 차이가 나는지 보기 위해 한 판매자가 잠깐 가격을 낮췄다가 다시 원래대로 돌아오는 상황을 시뮬레이션했다. 개인화 랭킹에서는 가격이 원래 수준으로 돌아오는 데 5번이 걸렸는데 비개인화 랭킹에서는 10번이 걸렸다. 비개인화 랭킹에서 높은 가격을 유지하려면 AI가 그만큼 더 복잡하고 오래가는 “보복” 전략을 배워야 한다는 뜻이다.
가장 인상적인 부분은 가격 하나를 바꿨을 때 순위가 얼마나 요동치는지 비교한 대목이다. 개인화 랭킹에서 고품질 판매자가 가격을 0.1 낮추면 1위 확률은 49.8%에서 52.2%로, 수요는 0.389에서 0.413으로 아주 조금만 올라간다. 그런데 비개인화 랭킹에서 똑같이 가격을 0.1 낮추면 1위 확률이 0%에서 100%로 뛰고 수요는 0.02에서 0.653으로 치솟는다. 단돈 10센트 차이로 순위가 꼴찌에서 1등으로 뒤바뀌는 것이다.
그림 1. 개인화 랭킹(왼쪽)에서는 가격을 낮춰도 순위가 거의 그대로지만, 비개인화 랭킹(오른쪽)에서는 순위가 요동친다. 이 차이가 AI의 담합적 고가격을 무너뜨리는 열쇠다. (개념을 설명하기 위한 예시 이미지)
이 방향성은 다른 조건에서도 대부분 유지되었다. 다만 한 가지 예외가 있는데, 개인화 랭킹의 정확도를 낮췄을 때 가격 자체는 크게 안 바뀌었지만 소비자잉여는 오히려 더 줄었다. 정확도가 떨어질수록 소비자가 다시 탐색해야 하는 수고가 늘기 때문이다. 어설픈 개인화는 오히려 안 좋은 점만 모아놓는 셈이다.
✔️ 결론
이 논문의 기여는 담합 연구의 지형을 한 칸 넓힌 데 있다. 기존 연구들은 대부분 AI가 어떻게 담합하는지, 그걸 막을 규칙을 어떻게 만들지에 집중해왔다. 반면 이 논문은 플랫폼의 랭킹 방식이라는 새로운 변수를 끌어왔다. 가격 알고리즘 자체를 규제하기 어렵다면, 플랫폼이 상품을 어떤 순서로 보여주는지만 바꿔도 담합을 억제할 수 있다는 것이다.
소비자 데이터 이야기와도 연결된다. 데이터를 더 많이 모아서 개인화를 정교하게 할수록 상품 매칭은 좋아지지만 동시에 AI가 가격을 담합적으로 올릴 여지도 함께 커진다. “데이터를 더 주면 더 좋은 서비스를 받는다”는 익숙한 생각이 적어도 가격 측면에서는 그대로 맞지 않을 수 있다는 뜻이다.
이 연구는 실제 데이터가 아니라 시뮬레이션에 기반하고 있어서 실제 플랫폼에서도 이 정도 크기의 효과가 나타나는지는 앞으로 더 확인이 필요하다. 저자들도 이 부분을 향후 과제로 남겼다. 다음에 살펴볼 컨슈머 리포트의 인스타카트 조사가 해당 질문에 좋은 참고점이 된다.
✔️ 참고문헌
- Calvano, E., Calzolari, G., Denicolò, V., & Pastorello, S. (2020). Artificial intelligence, algorithmic pricing, and collusion. American Economic Review, 110(10), 3267–3297. doi.org/10.1257/aer.20190623
- Qiu, L., Huang, Y., Singh, P. V., & Srinivasan, K. (2025). Personalization, consumer search, and algorithmic pricing. Marketing Science, 44(6), 1278–1298. doi.org/10.1287/mksc.2023.0455
- Weitzman, M. L. (1979). Optimal search for the best alternative. Econometrica, 47(3), 641–654.
📌 같은 장바구니, 다른 계산서 — 인스타카트의 AI 가격 실험
Kravitz, D. “Instacart’s AI-Enabled Pricing Experiments May Be Inflating Your Grocery Bill.” Consumer Reports (Groundwork Collaborative, More Perfect Union 공동 조사), 2025.12.9 (2025.12.22 업데이트)
✔️ 소개 및 요약
같은 순간, 같은 매장에서, 같은 장바구니를 담았는데 계산서 금액이 다르다. 컨슈머 리포트(Consumer Reports)가 Groundwork Collaborative, More Perfect Union과 함께 인스타카트 앱을 대상으로 실제 소비자를 동원해 진행한 조사에서 나온 결과다. 앨버트슨스, 코스트코, 크로거, 세이프웨이, 스프라우츠, 타겟까지, 미국 대형 마트 여러 곳에서 이런 가격 실험이 벌어지고 있었다. 상품 하나당 가격 차이는 최대 2.56달러, 비율로는 최대 23%까지 벌어졌다. 이 조사가 나간 뒤, 북미 최대 온라인 장보기 서비스 인스타카트는 소매업체들에 제공해오던 이 가격 실험 기술을 중단했다.
그림 2. 같은 순간, 같은 매장에서, 같은 장바구니를 담았는데 계산서 금액은 달랐다. (개념을 설명하기 위한 예시 이미지)
✔️ 조사 배경 및 논리
이런 가격 차이를 어떻게 알아낼 수 있었을까. 애초에 알고리즘 가격 책정은 눈에 잘 띄지 않는다. 소비자는 자신에게 제시된 가격만 볼 뿐, 다른 사람에게 어떤 가격이 뜨는지는 확인할 방법이 없다. 컨슈머 리포트는 이 문제를 실험으로 풀어냈다. 여러 사람을 같은 시간 같은 매장에 동시 접속시켜 똑같은 장바구니를 담게 하면 평소에는 혼자만 보고 지나쳤을 가격을 서로 비교해 볼 수 있다는 아이디어였다.
이 가격 실험을 가능하게 한 건 인스타카트가 2022년 인수한 AI 가격 스타트업 Eversight였다. 인수 이후 인스타카트는 소매업체에 가격 최적화 소프트웨어를 제공해왔고 이 기술이 매출을 1~3%, 이익을 2~5% 끌어올릴 수 있다고 밝혀왔다. 가격 실험이 소비자에게 미치는 영향은 미미하다는 것도 인스타카트 측 설명이었다.
✔️ 데이터 및 조사 방법
이 아이디어를 실제로 구현하기 위해 컨슈머 리포트는 전국에서 자원봉사자 437명을 모집해 네 그룹으로 나눴다. 화상 회의로 동시에 접속하여 같은 소매업체(세이프웨이, 타겟)에서 18~20개 품목으로 구성된 동일한 장바구니를 채우게 했고, 워싱턴 D.C.에서는 대면으로도 같은 실험을 한 번 더 진행하여 결과를 재확인했다. 실제 구매는 하지 않고 각자 화면에 뜬 가격만 캡처해서 비교했다. 이렇게 모은 스크린샷 중 문제 없는 것만 추려 약 200건을 분석했고, 11월에는 온라인으로 앨버트슨스, 코스트코, 크로거, 스프라우츠 네 곳을 추가로 확인했다.
✔️ 조사 결과
이렇게 모은 스크린샷을 분석한 결과, 확인한 상품의 약 4분의 3이 소비자마다 다른 가격에 팔리고 있었다. 한 상품이 최대 다섯 가지 다른 가격으로 팔리는 경우도 있었다. 같은 상품의 가격 차이는 적게는 7센트, 많게는 2.56달러까지 벌어졌다.
시애틀의 한 세이프웨이 매장에서 진행한 테스트가 특히 인상적이다. 39명이 동일한 20개 품목을 담았는데 장바구니 총액이 114.34달러부터 123.93달러까지 다섯 가지로 갈렸다. 8.4% 차이다. 가장 낮은 가격을 받은 참가자는 전체의 8%뿐이었다. 인스타카트가 밝힌 4인 가구 평균 장보기 지출로 환산하면 이런 편차는 연간 약 1,200달러 차이로 이어질 수 있다.
이 가격 차이가 어떻게 만들어지는지는 우연히 드러났다. 코스트코가 실수로 컨슈머 리포트에 전달한 이메일에 인스타카트가 내부적으로 운영해온 가격 조정 방식이 언급되어 있었던 것이다. 상품별로 가격에 얼마나 민감하게 반응하는지 파악해서 가격 인식을 개선하면서 매출을 늘리려는 머신러닝 도구였다. 여기에 더해 컨슈머 리포트는 인스타카트가 미국의 대형 데이터 브로커 두 곳으로부터 개인 데이터를 확보해온 사실도 확인했다.
✔️ 결론
이 조사가 힘을 갖는 이유는 이론이나 추정이 아니라 실제 소비자 400명 이상이 동시에 겪은 가격 차이를 직접 보여줬다는 데 있다. 항공권이나 호텔처럼 수요에 따라 가격이 바뀌는 상품에는 소비자들도 어느 정도 익숙하다. 그런데 장보기처럼 생필품에 가까운 영역에서까지 이런 편차가 벌어진다는 사실은 다르게 받아들여진다. 실제로 조사에 인용된 설문에서도 인스타카트 이용자 대다수가 사람마다 다른 가격을 매기는 것에 반대했다.
이 흐름은 이미 규제 단계로 넘어가고 있다. 뉴욕주는 지난 11월부터 알고리즘이 개인 데이터를 활용해 가격을 정했다는 문구를 소비자에게 고지하도록 법으로 정했다. 미 연방거래위원회(FTC)도 2022년 개인정보에 기반한 부당한 가격 차별에 대한 가이드라인을 낸 데 이어 2024년에는 개인 맞춤형 가격 기술을 제공하는 기업 8곳에 자료 제출을 요구했다. 캘리포니아, 콜로라도, 펜실베이니아를 비롯한 여러 주에서도 관련 법안이 나와 있다.
이 조사는 앞서 다룬 Qiu 외 논문이 시뮬레이션으로 그려낸 우려와 맞닿아 있다. 다만 메커니즘은 다르다. Qiu 외 논문은 가격 차별 없이 랭킹 하나만으로 가격이 오르는 경우를 다뤘다면 이 조사는 소비자마다 아예 다른 가격을 매기는 더 직접적인 사례다. 개인화가 정교해질수록 소비자가 손해 볼 여지도 커진다는 경고는 두 사례 모두에서 공통적이다.
인스타카트는 이번 가격 실험에 개인의 인구통계나 데이터를 쓰지 않았고 상품별로만 가격을 무작위로 테스트했다고 밝혔다. 이것이 사실이라면 지금의 가격 차이는 최소한 “누구는 부자니까 비싸게 받자”는 식의 개인 맞춤형 차별은 아니라는 뜻이 된다. 컨슈머 리포트도 조사 과정에서 개인 데이터가 실제로 가격에 반영됐다는 정황은 찾지 못했다. 다만 인스타카트가 출원한 특허 문서에는 개인 데이터를 활용해 가격을 책정하는 기술이 설명되어 있어서 지금 당장은 아니어도 앞으로 이런 방식으로 이어질 가능성은 남아 있다.