Can We Measure Service Quality from Review Text, Not Star Ratings? 별점이 아닌 리뷰 텍스트로 서비스 품질을 잴 수 있을까?
Mejia et al. (2020) · MSOMMejia et al. (2020) · MSOM
Jorge Mejia, Shawn Mankad, Anandasivam Gopal (2020) Service Quality Using Text Mining: Measurement and Consequences. Manufacturing & Service Operations Management 23(6):1354–1372.
✔️ Introduction and Summary
When picking a restaurant, we typically look at the star rating and judge from there. But star ratings turn out to be a less reliable indicator than they seem. Run a review promotion and ratings tend to get inflated, and even among people who left two stars, the reasons behind that score can be completely different — someone who gave two stars because the food was bad and someone who gave two stars because they waited an hour end up mixed together behind the same number. The actual reason is written out in full in the review text, but the star rating alone can’t tell the two apart.
The paper covered in this issue takes this problem head-on. It asks whether the information hidden behind a star rating can be read directly from the review text, and further, whether that information can be used as a measure of service quality. The authors gathered roughly 130,000 Yelp reviews of restaurants in Washington, D.C. and used text mining (an analytical technique for extracting patterns from text) to pull out five dimensions of service quality. They then verify, across three stages, whether these dimensions are actually measuring quality: an experiment that has consumers directly classify reviews, a comparison against the industry-standard Zagat ratings, and a survival analysis (a statistical technique that examines what factors affect the timing of a business’s closure). To summarize the results, adding these text dimensions to a conventional model that predicted closure using only numeric variables like star rating and review count improved prediction accuracy by as much as 70%.
✔️ Research Content and Logic
Service quality has long been measured through surveys. SERVQUAL, a standardized questionnaire, is the best-known example — it uses 22 items to measure the gap between what a customer expected and what they actually experienced. Since it asks customers directly, this approach looks, at first glance, like the most reliable option. (Exactly what SERVQUAL is has been linked in the references at the very bottom.)
That said, the authors lay out four limitations of surveys. First, applying the same questionnaire as-is across different industries is trickier than it sounds, because what customers consider important differs by industry — “the staff was friendly” doesn’t carry the same weight toward overall satisfaction at a hospital as it does at a fast-food counter. So building a proper survey means tailoring its items to the industry. Second, once tailored that way, comparing similar businesses side by side becomes difficult. Third, survey results are averaged responses, so the variation between individual customers’ experiences isn’t reflected. Fourth, running a single round takes considerable time and money, which makes it hard to scale the survey up — say, to cover thousands of businesses every year.
Meanwhile, there has already been plenty of research using online reviews, but most of it treated only numeric signals like star ratings and review counts as the object of study. What the authors focus on instead is the text — which makes up most of a review but had gone underused until now. Their logic: a star rating compresses a range of experiences into a single number that doesn’t read the same way to everyone, whereas the text spells out concretely what was good and what was bad.
So how can one show that what’s extracted from the text is genuinely measuring service quality? The authors argue three conditions need to be satisfied: whether a review where a given semantic dimension shows up strongly is still recognized by a human reader as being about that dimension, whether the measure comes out consistently even against existing evaluations, and whether the service quality measured this way actually makes a difference to whether a restaurant survives.
Let’s check these three conditions one by one. First, a review where a given dimension shows up strongly should be recognized by a human reader as being about that dimension. If a computer classifies a review as “about wait time,” a human reading the same review should read it the same way — a pattern only a computer can recognize risks being statistical noise rather than quality. Second, the score produced from the text should show a consistent relationship with existing evaluations — it should move in the same direction as a score the same restaurant received through a completely different route. The authors use Zagat as the comparison, since Zagat scores come from evaluators who visit the restaurant in person, making it a suitable benchmark precisely because it’s derived through an entirely different route than text analysis. Third, service quality measured this way should actually make a difference to whether a restaurant survives in the real world. That restaurants with better service do better is a claim long accepted in this field, and if the indicator drawn from text truly reflects service quality, this relationship ought to show up in the data as well. The authors chose closure as this outcome variable — sales figures aren’t obtainable, but whether a business closed can be verified externally.
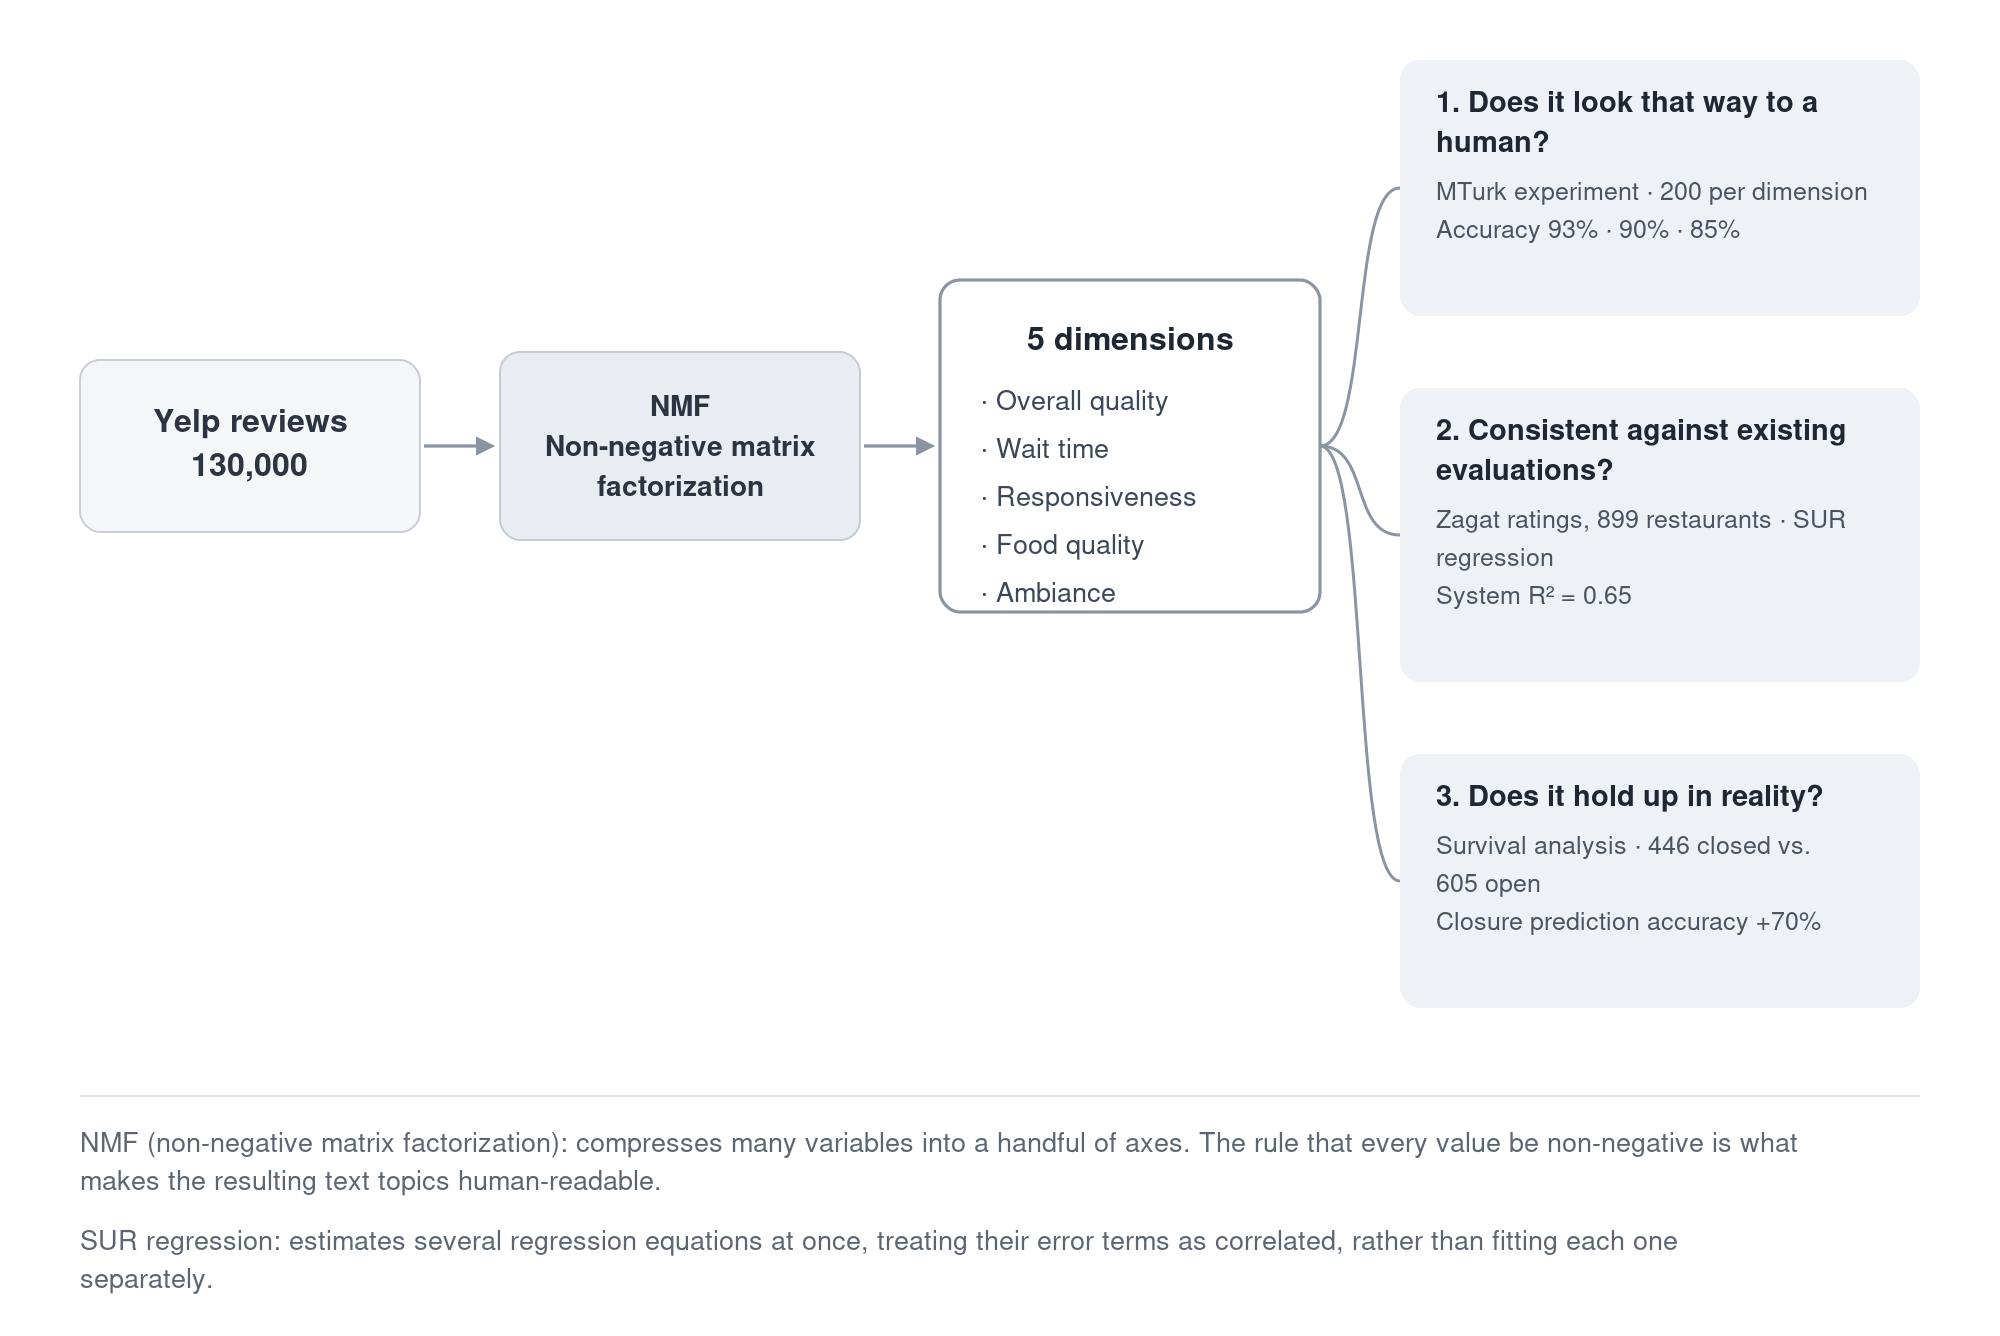
Figure 1. The paper’s verification structure.
Three different methods confirm whether the five dimensions extracted from text are genuinely “service quality.”
✔️ Data and Methodology
The study covers restaurants in Washington, D.C. The authors first put together a list of roughly 2,000 restaurants operating as of December 2013, drawn from the D.C. city government database. For closures, they combed through Yelp, Foursquare, and the local food outlets Eater and Gayot for restaurants that shut down between 2005 and 2013, gathering 575 — narrowed to 446 once restaurants located in Virginia or Maryland were excluded. They then went through these 446 one by one to confirm whether each had actually closed or simply relocated. Review data was collected not through web scraping but through Yelp’s official API: the authors submitted a research proposal in 2013, were approved, and received an API key, and gathered data while staying within a cap of 5,000 calls per day. Reviews Yelp itself flagged as fraudulent were excluded, leaving 130,000 reviews — equivalent to roughly 50,000 printed pages.
The text was first lowercased, words shorter than three letters and stopwords like “the” and “and” were removed, and stemming was applied (collapsing “values,” “valued,” and “valuing” all down to “valu”). The core methodology applied to this preprocessed text is NMF (Non-negative Matrix Factorization). It resembles PCA (principal component analysis) in that it compresses many variables down into a handful of axes, but differs in that instead of forcing the axes to sit at right angles to each other, it imposes the constraint that no value can be negative. In text analysis, this constraint is known to be advantageous for producing topics that a human can actually read and interpret. How many axes to split into was decided through cross-validation (a procedure that checks performance by splitting the data repeatedly), which yielded five dimensions: overall quality, wait time, food quality, responsiveness, and ambiance.
One thing worth noting here: these five dimensions measure how often a given topic is mentioned in a review, not whether that mention is positive or negative. Indeed, in the wait-time dimension the paper gives as an example, there’s a negative mention like “it took 30 minutes to make two burgers” alongside a positive one like “here you don’t need to wait two hours, it’s out in five minutes.” Both are about wait time, so they land on the same axis. And yet, looking at the results, the higher this score was, the lower the Zagat service rating and the higher the probability of closure — meaning the mere fact that wait time became a talking point in reviews was, on the whole, a negative signal. Restaurants where nobody has to wait simply don’t leave that kind of remark in a review in the first place.
Verification proceeded in three stages, each covering one of the three conditions mentioned above.
The first stage is an experiment using Amazon MTurk (a platform for recruiting a large pool of participants online to do simple tasks). Ahead of the main experiment, the authors ran a pilot with undergraduates, and for each dimension that passed the pilot, they recruited 200 participants and ran the main study. Participants were shown a single review of a hypothetical restaurant, laid out on a screen identical to Yelp’s, and asked about their perception of that restaurant’s quality and their intent to visit. The experimental design is a 2×2 factorial design: one factor is whether the mention of that dimension in the review is clear or faint, and the other is whether the star rating attached to that review is high or low. Whether participants’ responses differed from random guessing was checked with a binomial test (a test for whether results differ from what you’d get from flipping a coin, i.e., 50/50 odds).
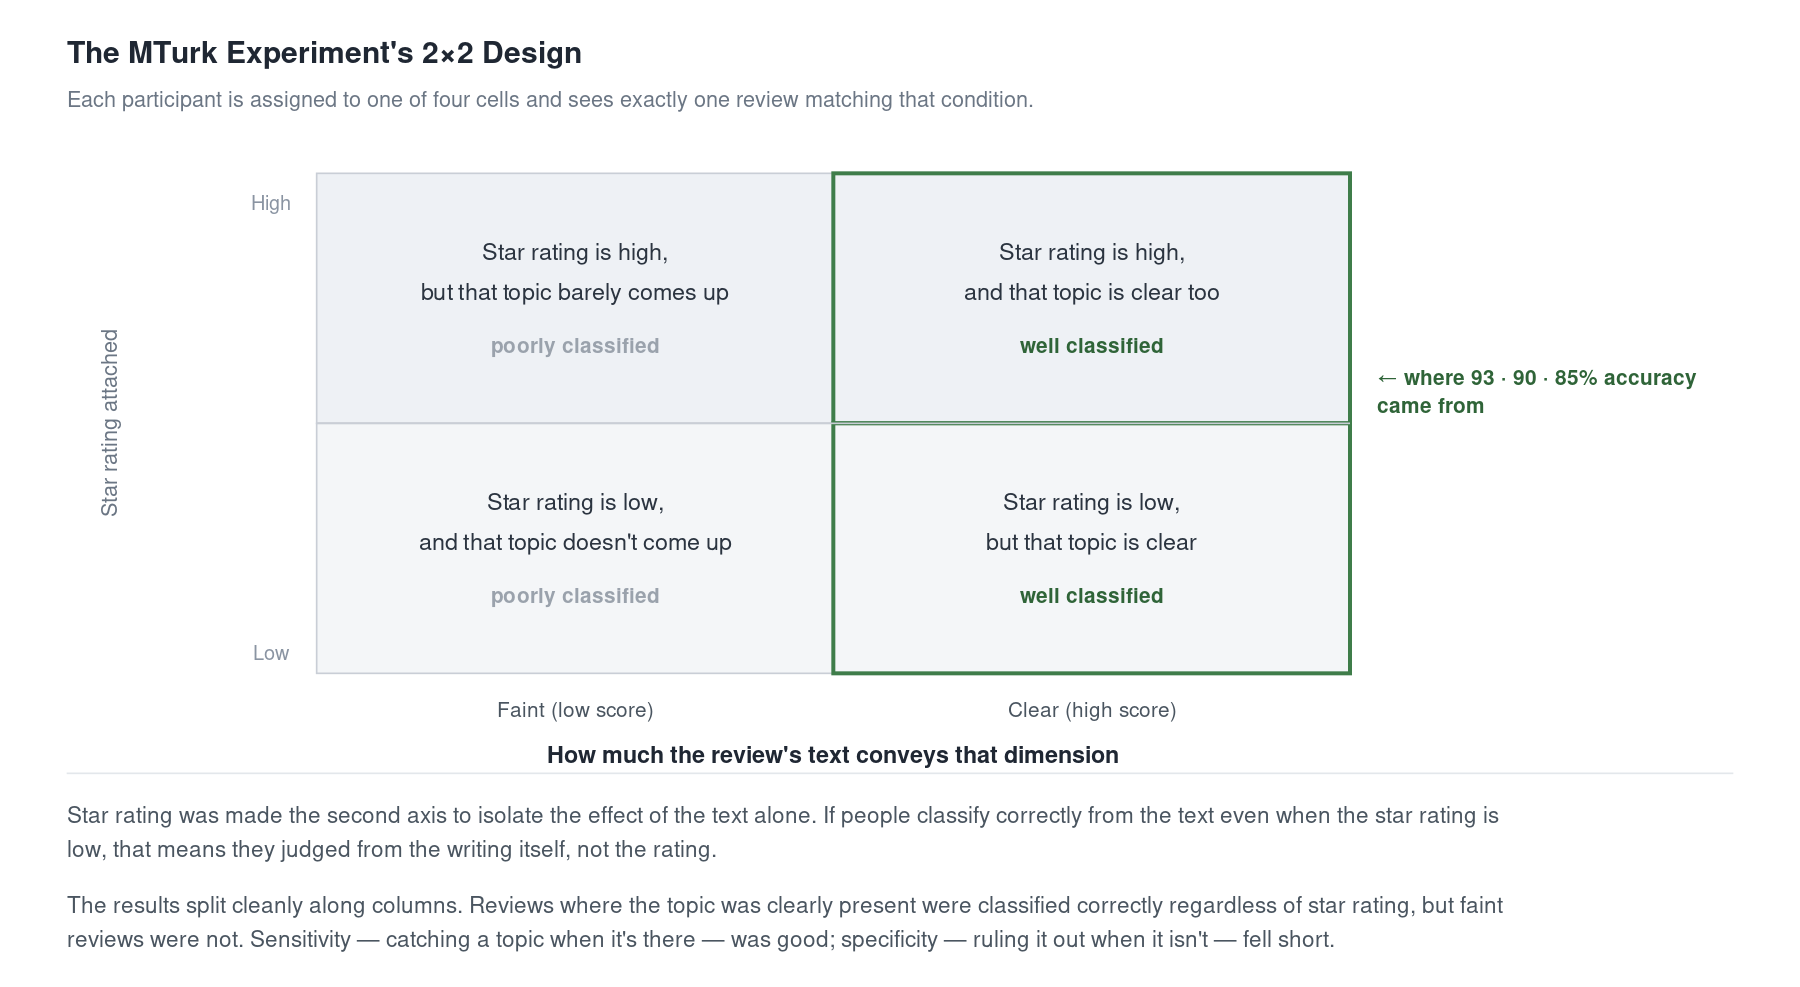
Figure 2. The MTurk experiment’s 2×2 design.
The second stage is a comparison with the Zagat guide. Zagat is a resource in which local food-critic editors compile surveys submitted by anonymous volunteers and score each restaurant out of 30 points across three categories — food, décor, and service. Since this data was only ever available in book form, the authors directly hand-coded the editions from 2005 through 2013 (excluding 2009, when no edition was published). Matching by restaurant name, address, and phone number, they secured 899 restaurants, and the analysis used SUR regression (Seemingly Unrelated Regression — a method that, rather than estimating several regression equations individually, estimates them simultaneously while accounting for the correlation between their error terms).
The third stage is survival analysis. The 446 closed restaurants were matched to comparable, still-open restaurants using CEM (Coarsened Exact Matching). The reason for matching is that comparing closed and open restaurants as-is would let differences in factors other than service quality bleed into the analysis results.
CEM groups values like star rating, review count, price range, and cuisine type into a handful of bins, then pairs only restaurants that fall into an identical bin across every one of those variables. For instance, if a closed restaurant falls into the bin “3-point-something stars · 50-something reviews · mid-range price · Italian,” it’s paired against an open restaurant that falls into that same bin; if no counterpart exists in that bin, the restaurant is dropped from the analysis. Restaurants with similar conditions need to be compared against each other in order to isolate what the text dimensions themselves are contributing. A panel logit model was then estimated with whether the restaurant closed in the following quarter as the dependent variable, controlling for location, competitive intensity, review length, and readability. To reduce the possibility of reverse causality (a situation where declining service quality isn’t the cause, but rather closure is decided first and reviews’ mentions of service quality worsen as a consequence), the independent variables used values lagged by one quarter.
✔️ Findings
To summarize the matching results: all 446 closed restaurants were matched against 605 still-open restaurants. Of the 2,021 open candidates, only about one in three was selected as a match; the rest were excluded because no closed restaurant shared their bin. The two groups had similar average star ratings (3.26 vs. 3.31) and review counts (54.8 vs. 59.5), suggesting the matching was done appropriately. The final panel was made up of 16,515 observations across 1,035 restaurants.
First condition — does a review where a dimension shows up strongly get recognized by a human reader as being about that dimension? Participants classified reviews with 93%, 90%, and 85% accuracy for the overall-quality, wait-time, and responsiveness dimensions respectively — far above what random guessing would produce (50% under the binomial test). But there’s a limitation the authors state candidly here: this accuracy held when the mention of that dimension was clearly present in the review, and dropped when the review’s mention was faint. Wait time in particular was statistically indistinguishable from chance.
To sum up, when content wasn’t explicitly spelled out in a review — something like “it was disappointing because the wait was too long” — participants couldn’t classify it properly. The authors attribute this to the tendency of online reviews to skew generous overall: since the average star rating sits above 4 out of 5, signals that are clearly spelled out in a review match what people expect and are easy to pick up on, but faint or ambiguous text is hard to read the meaning of.
That covers verification on the human side — but there are two dimensions for which this verification couldn’t even be attempted: food quality and ambiance. These two dimensions couldn’t be included in the main experiment because participants in the undergraduate pilot were unable to tell them apart. But the substantive cause the authors point to isn’t the participants — it’s a limitation of the model itself. NMF extracts five axes from the reviews, and these two dimensions came out as the fourth and fifth axes extracted. As with PCA, the variance explained shrinks the further back an axis is ordered, so these two dimensions had relatively weak discriminating power. Indeed, looking at the representative words for the two dimensions, many overlap with the overall-quality dimension — words like “food” and “good.” Because the boundary between the axes themselves was blurry, participants had a hard time telling them apart too. That said, the authors make clear this doesn’t mean food quality and ambiance aren’t important as elements of service quality.
Second condition — does the score produced from the text show a consistent relationship even against existing evaluations? Compared against Zagat, the system as a whole produced an R² of 0.65. The correspondence was fairly clear, too: overall quality correlated with all three Zagat categories, and wait time and responsiveness corresponded to Zagat’s service item. The negative coefficient on the wait-time side (−2.99) is consistent with what was described earlier in the methodology — meaning the more wait time came up as a talking point in reviews, the lower the expert-assigned service score. Food quality corresponded to Zagat’s food item, and ambiance to its décor item, respectively. What’s worth noting here is that food quality and ambiance — the two dimensions that couldn’t be verified in the MTurk experiment — showed a significant correspondence at this stage.
Third condition — does the service quality measured this way actually make a difference to whether a restaurant survives in reality? The survival analysis results show that the text dimensions had a significant relationship with restaurant closure. The higher the overall-quality dimension score, the lower the probability of closing the following quarter (p<0.001 — meaning there’s less than a 0.1% chance this result occurred by chance, and this held consistently across all four models), while the higher the wait-time dimension score, the higher the probability of closure (p<0.01). Earlier it was noted that a mention of wait time alone only captures one facet of service — this result means that facet alone carries enough weight to swing whether a restaurant closes. Responsiveness was only significant at the more limited p<0.1 level.
What stands out here is that these text dimensions had a bigger effect on closure than the average star rating did. Since all variables were entered into the analysis on the same standardized scale, their coefficient sizes can be compared directly — and the data backs up the authors’ claim that text carries more information than a star rating. Compared with a conventional model using only numeric variables, model fit improved by 16% on AIC and 10% on BIC, and closure-prediction accuracy improved by as much as 70%. Food quality and ambiance, on the other hand, were not significant in any model.
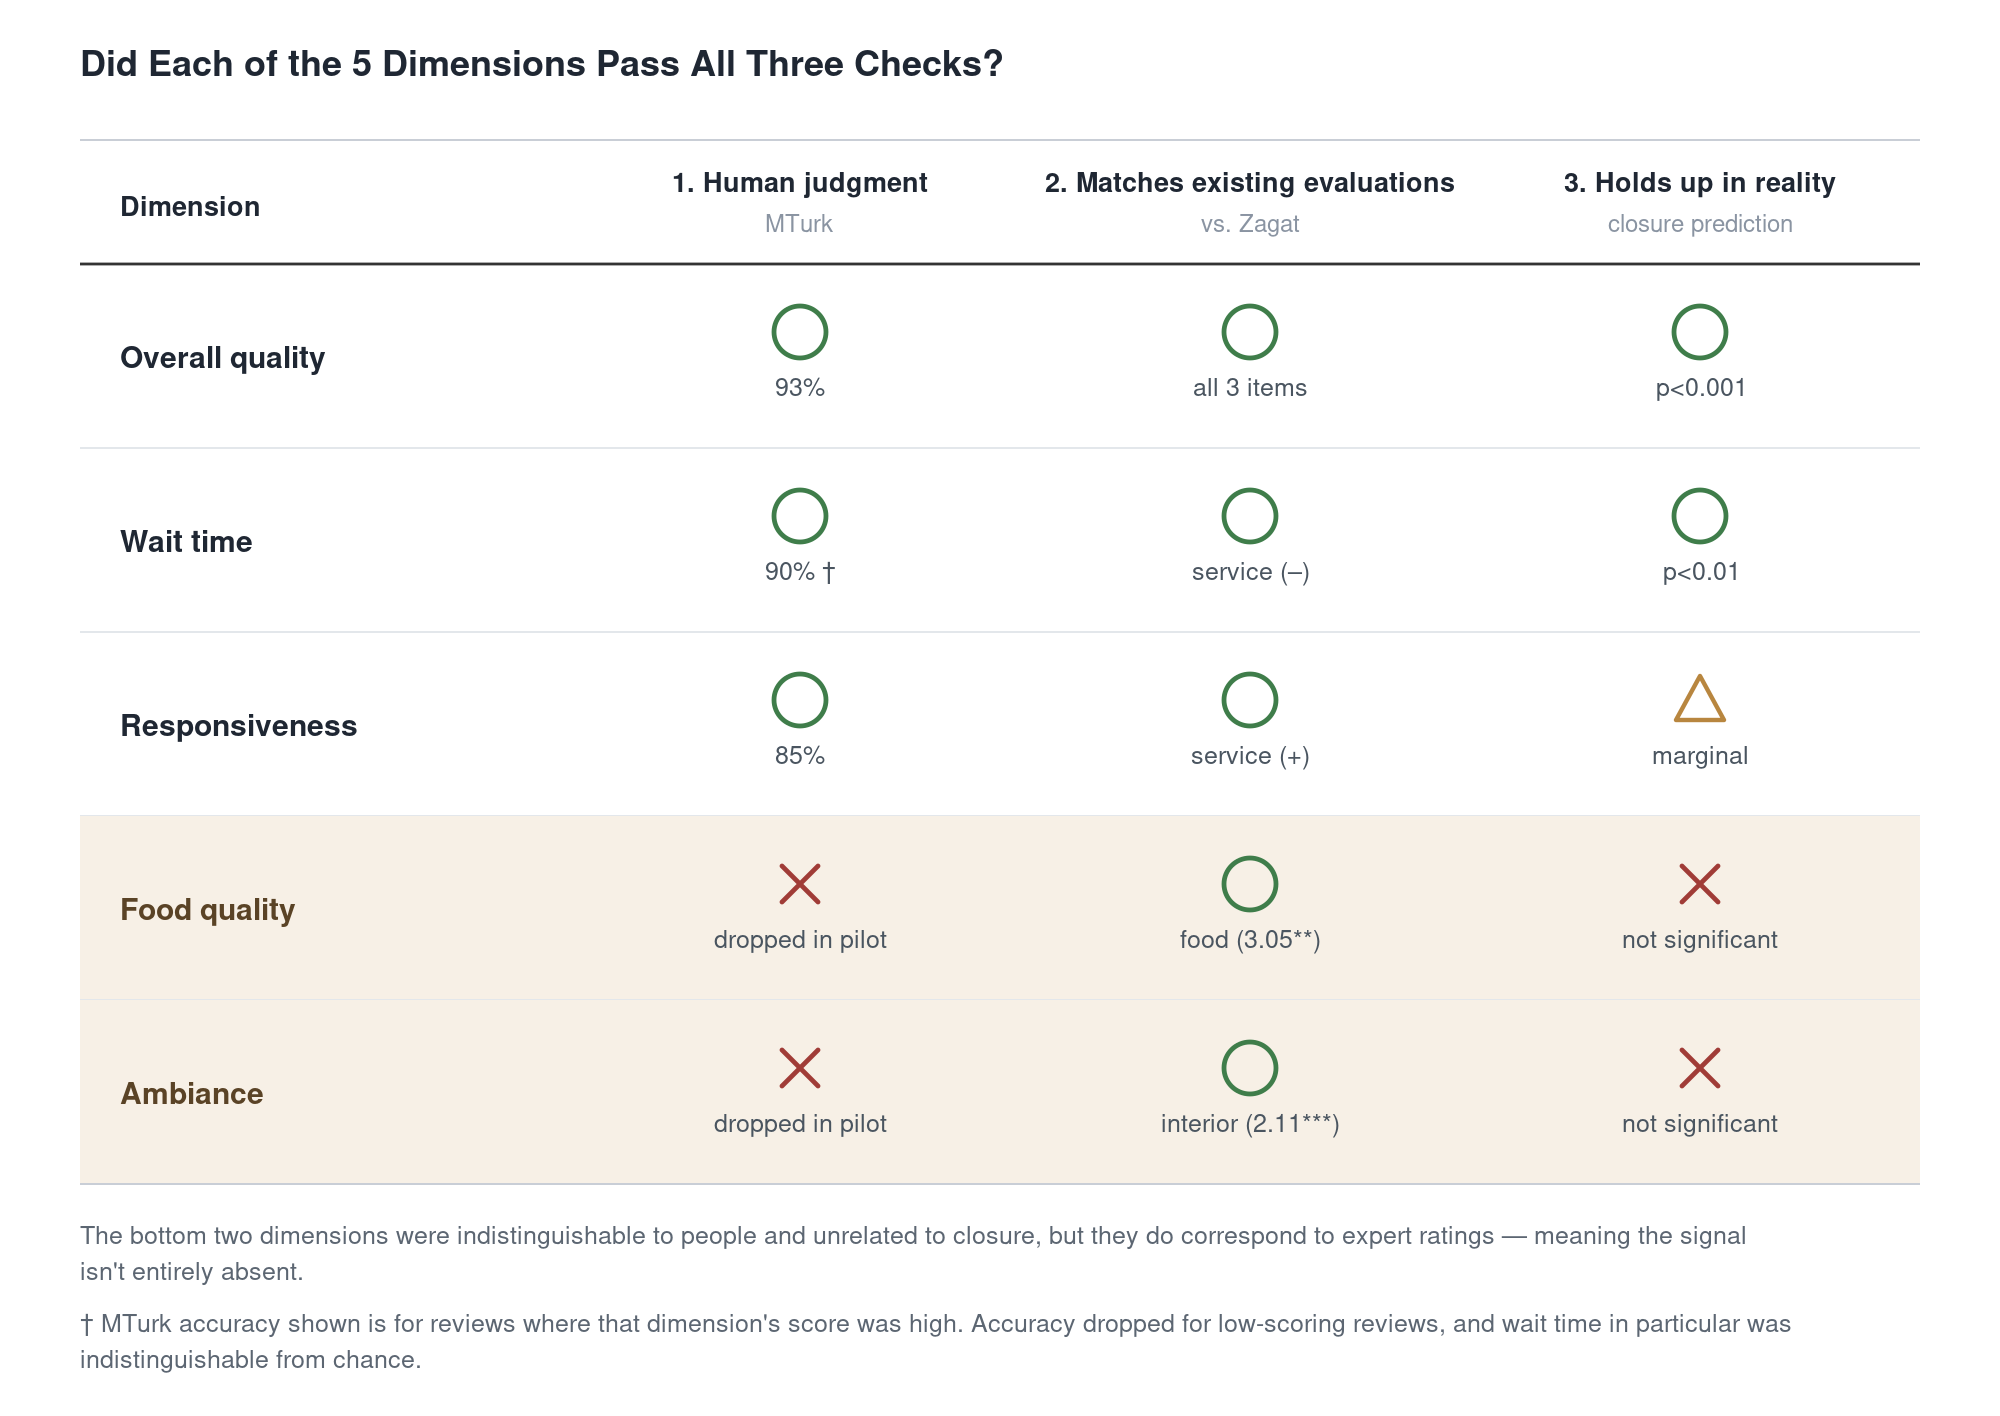
Figure 3. A table summarizing whether each of the five dimensions passed each of the three verification conditions.
The authors also check the explanation running in the opposite direction — that it’s not declining service quality that leads to closure, but rather that once a closure decision is made, operators grow neglectful of running the store, and service quality deteriorates as a belated consequence. To check this, they interviewed people at the National Restaurant Association and confirmed that restaurant owners who decide to close overwhelmingly wind down operations as quickly as possible, and the actual data showed that quality scores stayed flat right up until about 1.5 months before closure. On top of this, they add the reasoning that since hundreds of reviewers each wrote independently, it’s unlikely that all of them sensed the closure coming and wrote accordingly. Robustness checks were also carried out broadly — a Cox proportional hazards model that treats the timing of closure as survival-time data, alternative matching methods, controlling for how many years the restaurant had been open, re-estimating in six-month windows instead of quarters, and re-estimating with longer lags — and the results held up consistently across all of these. Even so, the authors make clear that this doesn’t amount to proof of causality.
✔️ Conclusion
This paper presents a way to measure service quality at scale without being tied to any one industry, and goes on to confirm that the value measured this way is actually associated with the outcome of closure. Applying NMF to Yelp review text, the authors extract five dimensions of service quality, verify them through two separate routes — the MTurk experiment and the Zagat comparison — and finally connect them to closure data for Washington, D.C. restaurants from 2005 to 2013. The result: information that a single star rating alone fails to capture was written into the text dimensions, and this information contributed meaningfully to predicting whether a business closed. To borrow a phrase from a National Restaurant Association report, “online reviews can make or break a business” — and this paper backs that claim with data.
To sum up, this paper takes on, together, the problem of measuring service quality at scale and the problem of connecting that measurement to a firm’s actual performance. This matters because these two things had long gone insufficiently addressed in service-quality research. Existing indicators like surveys or wait times can be accurate, but are hard to repeat at scale across industries, and while plenty of research has connected service quality to individual process performance, research connecting it to a firm’s overall fate — like whether a restaurant survives — has been rare.
That said, this paper doesn’t answer every question, and the authors themselves are clear about its limitations. With no sales data available, they had no choice but to rely on closure — a somewhat extreme outcome variable — and this analysis is grounded in one particular topic-modeling technique, NMF, leaving room to verify the same question with other methods.
Even so, the paper’s practical implications are clear. Restaurant operators can use this method to see which of their service elements are lacking relative to competitors, and investors or landlords without access to financial information can use it to gauge a business’s current standing — this is the point the authors emphasize. A platform like Yelp could, in principle, consider offering dimension-level scores like these instead of a single star rating.
✏️ Contributor’s Note
While reading this, a project from my “text mining” class kept coming back to mind. It was a project that tried to measure public opinion by gathering internet posts and comments instead of running a survey — the idea itself was nearly identical to this paper’s. The difference is that this paper checks, far more relentlessly, whether the indicator it extracted is actually measuring performance. I ended my project after crawling the data with hardly any further validation, but this paper asks people directly, checks the result against expert evaluations, and even connects it to whether a business closed. That attitude was the most worth learning from.
Questions remain, too. Would the five dimensions extracted from a single city, Washington, D.C., show up the same way in New York or a smaller regional city? Isn’t it possible that even sensitivity to wait time differs from city to city? In the end, this comes down to asking whether results drawn from one region hold up in another — and whether a model trained in one environment generalizes to another is a question that’s been treated separately in deep learning recently under the name domain generalization. It was reassuring to see a similar concern show up in a different field.
📎 References
For readers who want to dig further into the terms and sources mentioned in this piece.
SERVQUAL — the tool cited in this piece as the representative “traditional survey method.” It measures, across 22 items, the gap between what a customer expected from a service and what they felt they actually received, and organizes the results into five categories: tangibles, reliability, responsiveness, assurance, and empathy. Since its publication in 1988, it has been used as something close to the standard for measuring service quality.
Parasuraman, A., V. A. Zeithaml, and L. L. Berry. “SERVQUAL: A Multiple-Item Scale for Measuring Consumer Perceptions of Service Quality.” Journal of Retailing 64(1) (1988): 12–40. semanticscholar.org
PCA (Principal Component Analysis) — a technique for compressing information that would otherwise be tangled across many variables into a handful of representative axes. The NMF used in this paper adds one further condition on top of PCA: every value must be zero or greater.
CEM (Coarsened Exact Matching) — a matching technique that groups variable values into a handful of bins, pairs only observations that land in the same bin, and discards any observation left without a match.
Iacus, S., G. King, and G. Porro. “Causal Inference without Balance Checking: Coarsened Exact Matching.” Political Analysis 20(1) (2012): 1–24. doi.org/10.1093/pan/mpr013
Zagat — the industry-standard rating used as the comparison point in this piece. It’s a leading US crowdsourced restaurant-rating publication in which a local food-critic editor compiles anonymous volunteers’ surveys and scores food, décor, and service out of 30 points each. During the 2005–2013 period this paper covers, it existed only in book form.
Jorge Mejia, Shawn Mankad, Anandasivam Gopal (2020) Service Quality Using Text Mining: Measurement and Consequences. Manufacturing & Service Operations Management 23(6):1354–1372.
✔️ 소개 및 요약
식당을 고를 때 우리는 흔히 별점을 보고 판단한다. 그런데 별점은 생각보다 믿기 어려운 지표다. 리뷰 이벤트를 진행하면 별점이 후해지는 경향이 있고, 별 2개를 준 사람들의 속사정도 제각각이다. 음식이 별로여서 2개를 준 사람과 한 시간을 기다려서 2개를 준 사람이 같은 숫자 뒤에 뒤섞여 버리는 것이다. 정작 그 이유는 리뷰 텍스트에 고스란히 적혀 있는데, 별점만 봐서는 이를 구분할 수 없다.
이번 이슈에서 다룰 논문은 이 문제를 정면으로 다룬다. 별점 뒤에 숨겨진 정보를 리뷰 텍스트에서 직접 읽어낼 수 있는지, 나아가 이를 서비스 품질의 측정치로 쓸 수 있는지를 검증하는 것이다. 저자들은 워싱턴 D.C. 소재 레스토랑들의 Yelp 리뷰 13만여 건을 모아 텍스트 마이닝(텍스트에서 패턴을 추출하는 분석 기법)으로 서비스 품질의 다섯 개 차원을 추출했다. 그리고 이 차원들이 실제로 품질을 측정하고 있는지를 세 단계에 걸쳐 검증한다. 소비자를 대상으로 리뷰를 직접 분류하게 하는 실험, 업계 표준인 Zagat 평가와의 비교, 그리고 생존 분석(어떤 요인이 폐업 시점에 영향을 미치는지 보는 통계 기법)이다. 결과를 요약하면, 별점과 리뷰 수 같은 숫자 변수만으로 폐업을 예측하던 기존 모형에 이 텍스트 차원들을 더했을 때, 예측 정확도가 70%만큼 향상되었다.
✔️ 연구 내용 및 논리
서비스 품질은 오래전부터 설문으로 측정되어 왔다. SERVQUAL 같은 표준화된 설문지가 대표적인데, 22개 문항으로 손님이 기대했던 것과 실제로 경험한 것 사이의 격차를 재는 방식이다. 손님에게 직접 물어보는 방식이니 언뜻 가장 확실해 보인다. (SERVQUAL이 정확히 무엇인지는 맨 아래 참고 자료에 링크를 달아두었다.)
다만 저자들은 설문에 네 가지 한계가 있다고 정리한다. 첫째, 같은 설문지를 여러 업종에 그대로 적용하기가 생각보다 까다롭다. 손님이 무엇을 중요하게 보는지가 업종마다 다르기 때문이다. 병원에서 “직원이 친절했다”와 패스트푸드점에서 “직원이 친절했다”는 전체 만족도에서 차지하는 비중이 같지 않다. 그래서 제대로 된 설문을 만들려면 업종에 맞게 문항을 조정해야 한다. 둘째, 그렇게 조정하고 나면 이번엔 비슷한 업체끼리 나란히 놓고 비교하기가 어려워진다. 셋째, 설문 결과는 응답을 평균 낸 값이라 손님마다 다른 경험이 반영되지 않는다. 넷째, 한 번 진행하는 데 시간과 비용이 크게 들어서, 수천 개 업체를 대상으로 매년 조사하는 식으로 조사 규모를 확장하기가 어렵다.
한편 온라인 리뷰를 다룬 연구도 이미 많았지만, 대부분 별점이나 리뷰 수 같은 숫자 지표만을 대상으로 했다. 저자들이 주목하는 지점은 리뷰의 대부분을 차지하면서도 그동안 충분히 활용되지 않았던 텍스트다. 별점은 여러 경험을 숫자 하나로 압축한 것이라 사람마다 같은 뜻으로 읽히지 않지만, 텍스트에는 어떤 면이 좋았고 어떤 면이 나빴는지가 구체적으로 나뉘어 서술되어 있다는 것이 저자들의 논리다.
그렇다면 텍스트에서 추출한 것이 실제로 서비스 품질을 측정하고 있다는 점은 어떻게 보일 수 있을까. 저자들은 세 가지 조건이 충족되어야 한다고 본다. 특정 의미론적 차원이 강하게 나타나는 리뷰는 사람이 읽어도 그 차원의 내용으로 인식되는지, 기존 평가와 비교해도 일관되게 나오는지, 그리고 그렇게 측정된 서비스 품질이 실제로 레스토랑의 생존 여부에 차이를 만들어내는지다.
이 세 가지 조건을 하나씩 확인해 보자. 첫째, 특정 의미론적 차원이 강하게 나타나는 리뷰는 사람이 읽어도 그 차원의 내용으로 인식되어야 한다. 컴퓨터가 “이 리뷰는 대기시간에 관한 것”이라고 분류했다면, 사람이 같은 리뷰를 읽었을 때도 그렇게 읽혀야 한다는 뜻이다. 컴퓨터만 알아보는 패턴이라면 그것은 품질이 아니라 통계적 잡음일 수 있다. 둘째, 텍스트에서 산출한 점수가 기존 평가와 비교해도 일관된 관계를 보여야 한다. 같은 식당을 다른 방식으로 평가한 점수와도 같은 방향으로 움직여야 한다는 뜻이다. 저자들은 비교 대상으로 Zagat을 쓰는데, Zagat은 평가자가 식당을 직접 방문해 매기는 평가라 텍스트 분석과는 전혀 다른 경로로 산출된 값이기 때문에 비교 기준으로 적합하다. 셋째, 그렇게 측정된 서비스 품질은 현실에서 실제로 레스토랑의 생존 여부에 차이를 만들어내야 한다. 서비스가 좋은 가게가 더 잘 된다는 것은 이 분야에서 오래 받아들여져 온 주장인데, 텍스트에서 추출한 지표가 진짜 서비스 품질을 반영한다면 이 관계가 데이터에서도 확인되어야 맞다. 저자들은 이 결과 변수로 폐업 여부를 택했다. 매출 자료는 구할 수 없지만 폐업 여부는 외부에서도 확인 가능하기 때문이다.
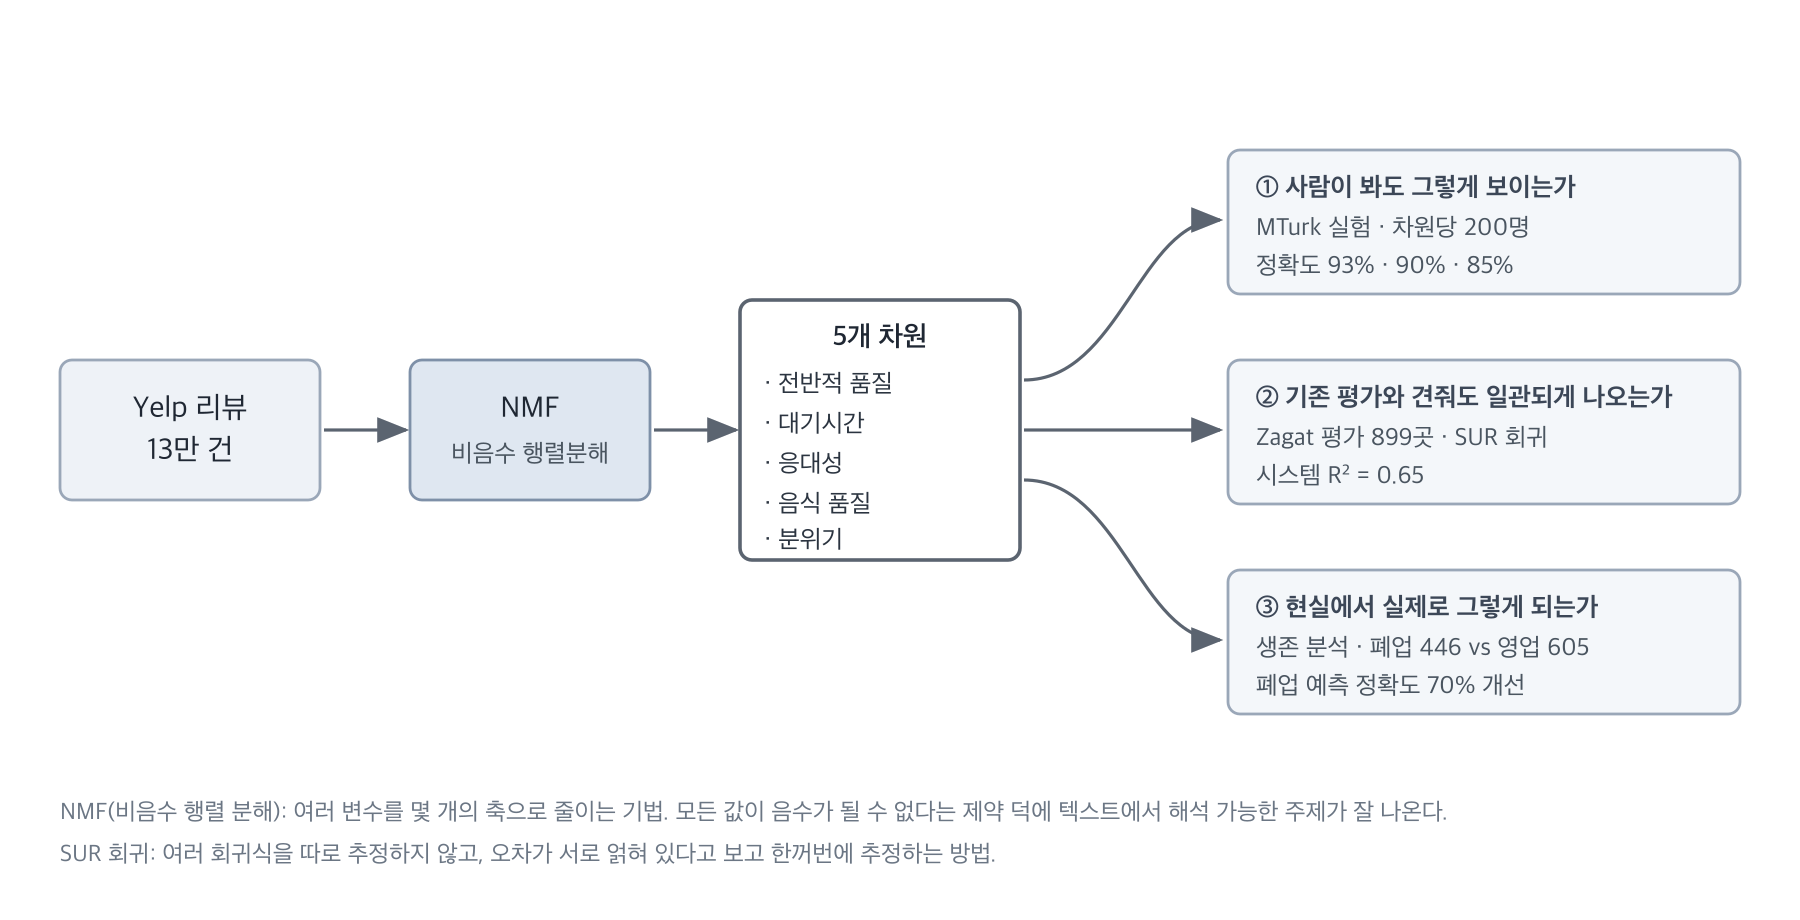
그림 1. 논문의 검증 구조. 텍스트에서 뽑은 5개 차원이 진짜 ‘서비스 품질’인지를 서로 다른 세 방식으로 확인한다.
✔️ 데이터 및 방법론
연구 대상은 워싱턴 D.C.의 레스토랑이다. 저자들은 D.C. 시청 데이터베이스에서 2013년 12월 기준 영업 중인 레스토랑 2,000여 곳의 명단을 먼저 확보했다. 폐업한 곳은 Yelp, Foursquare, 그리고 지역 음식 소식을 다루는 Eater와 Gayot을 통해 조사해 2005년부터 2013년 사이 폐업한 575곳을 모았고, 이 중 버지니아나 메릴랜드에 위치한 곳을 제외하니 D.C. 안쪽만 446곳이 남았다. 이후 이 446곳이 실제로 폐업한 것인지, 아니면 단순히 자리를 옮긴 것인지를 하나씩 직접 확인했다. 리뷰 데이터는 웹 스크래핑 대신 Yelp 공식 API를 통해 수집했다. 2013년에 연구 계획서를 제출해 승인을 받고 API 키를 발급받았으며, 하루 5,000회로 제한된 호출 횟수를 지켜가며 데이터를 모았다. Yelp가 부정 리뷰로 표시한 항목은 제외했고, 그렇게 남은 리뷰가 13만 건으로, 종이로 환산하면 약 5만 페이지에 해당한다.
텍스트는 먼저 소문자로 변환하고, 세 글자 미만 단어와 the·and 같은 불용어를 제거한 뒤, 어간 추출(values·valued·valuing을 모두 valu로 통일하는 식의 처리)을 거쳤다. 이렇게 전처리된 텍스트에 적용한 핵심 방법론이 NMF(비음수 행렬 분해)다. 여러 변수를 몇 개의 축으로 축약한다는 점에서 PCA(주성분 분석)와 유사하지만, 축을 서로 직각으로 두는 대신 모든 값이 음수가 될 수 없다는 제약을 부과한다는 점이 다르다. 텍스트 분석에서는 이 제약이 사람이 읽고 해석할 수 있는 주제를 도출하는 데 유리하다고 알려져 있다. 몇 개의 축으로 나눌지는 교차검증(데이터를 나누어 성능을 확인하는 절차)을 통해 정했고, 그 결과 전반적 품질, 대기시간, 음식 품질, 응대성, 분위기라는 다섯 개 차원이 도출되었다.
여기서 한 가지 유의할 점이 있다. 이 다섯 개 차원은 해당 주제가 리뷰에서 얼마나 자주 언급되는지를 측정하는 것이지, 그 내용이 긍정적인지 부정적인지를 직접 측정하는 것은 아니다. 실제로 논문이 예로 든 대기시간 차원의 리뷰를 보면 “버거 두 개를 만드는 데 30분이 걸렸다”는 부정적 언급도 있고, “여기는 두 시간씩 기다릴 필요 없이 5분이면 나온다”는 긍정적 언급도 있다. 둘 다 대기시간을 다루고 있으므로 같은 축에 실린다. 다만 분석 결과를 보면 이 점수가 높을수록 Zagat의 서비스 평가는 낮았고 폐업 확률도 높았다. 즉 대기시간이 리뷰에서 화제가 된다는 사실 자체가 대체로 부정적 신호였던 셈이다. 기다릴 필요가 없는 식당은 애초에 그 이야기를 리뷰에 남기지 않기 때문이다.
검증은 세 단계로 이루어지며, 각 단계는 앞서 언급한 세 조건을 하나씩 확인한다.
첫 번째 단계는 아마존 MTurk(온라인으로 다수의 참가자를 모아 간단한 작업을 맡기는 플랫폼)를 이용한 실험이다. 본 실험에 앞서 대학생을 대상으로 파일럿 실험을 먼저 진행했고, 이를 통과한 차원에 대해서만 각각 참가자 200명을 모집해 본 실험을 진행했다. 참가자에게는 가상의 식당에 대한 리뷰 하나를 Yelp와 동일한 화면 구성으로 제시하고, 해당 식당의 품질에 대한 인식과 방문 의향을 물었다. 실험 설계는 2×2 요인설계다. 해당 차원에 대한 언급이 리뷰에서 뚜렷한지 희미한지가 하나의 요인이고, 그 리뷰에 붙은 별점이 높은지 낮은지가 다른 하나의 요인이다. 참가자들의 응답이 무작위로 답했을 때와 다른지는 이항검정(동전을 던져 반반의 확률로 답했을 경우와 결과가 다른지를 보는 검정)으로 확인했다.
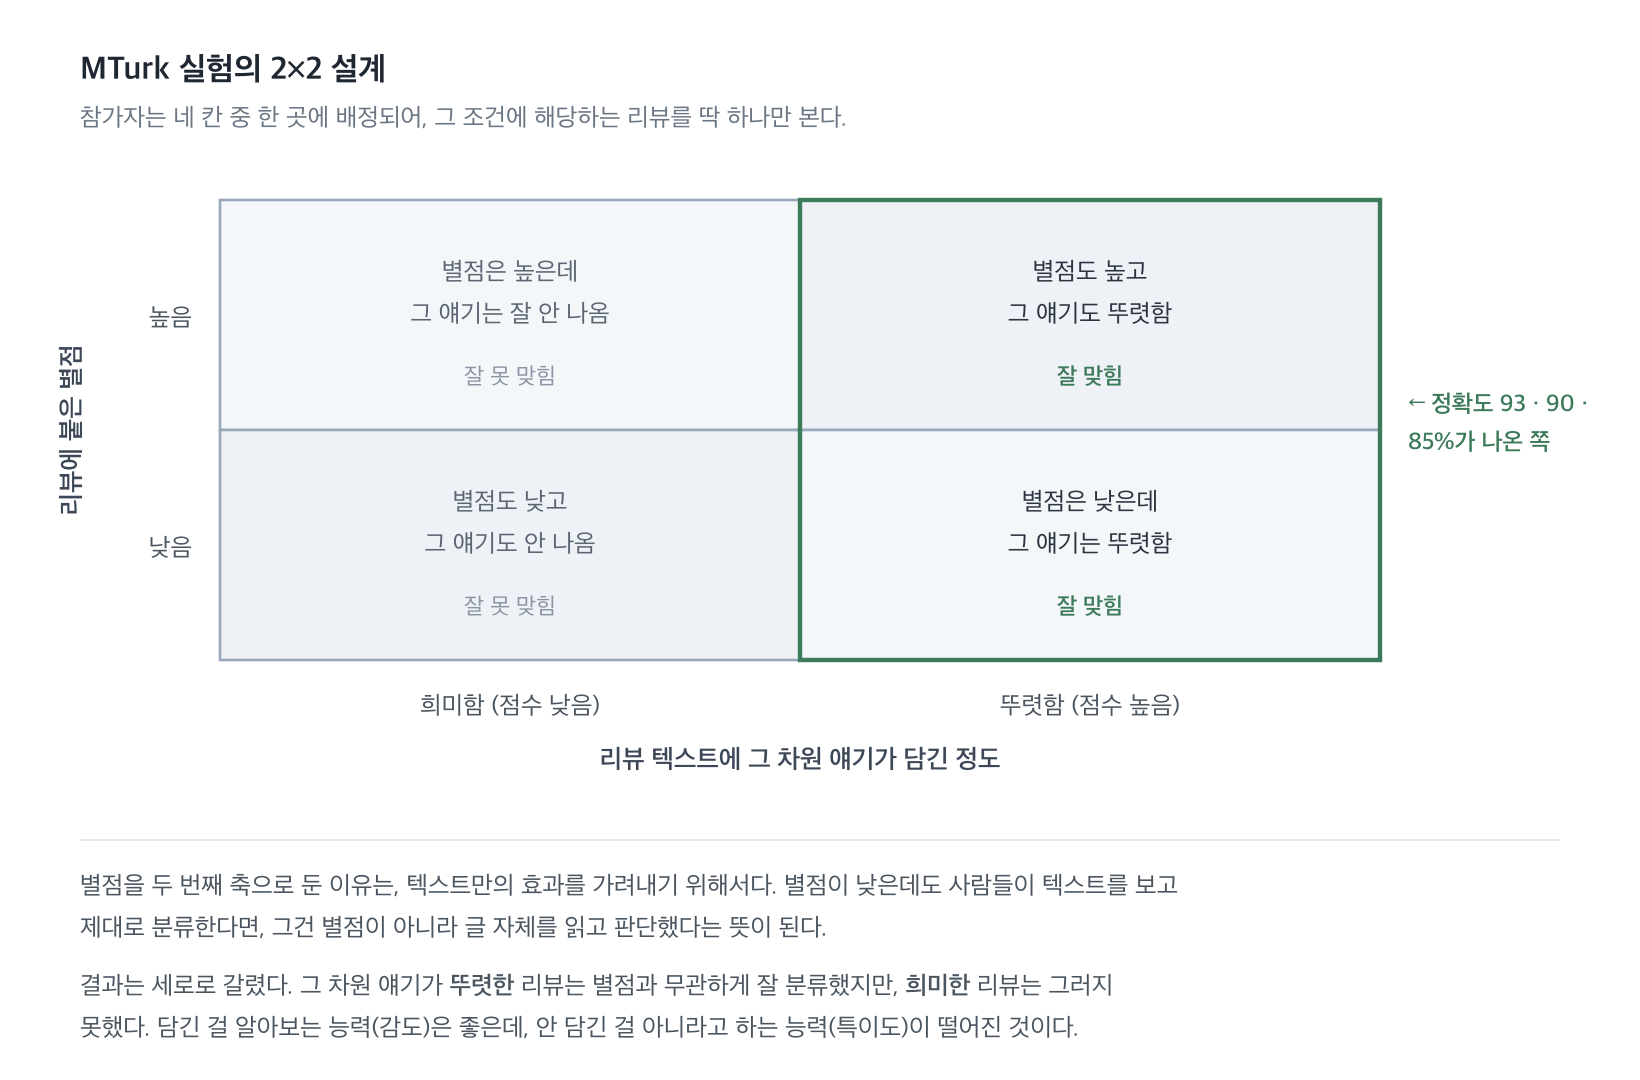
그림 2. MTurk 실험의 2×2 설계.
두 번째 단계는 Zagat 가이드와의 비교다. Zagat은 익명의 자원자들이 제출한 설문을 지역 음식 평론가인 편집자들이 취합해 음식·인테리어·서비스 세 항목에 대해 30점 만점으로 점수를 매기는 자료다. 이 자료는 책 형태로만 제공되었기 때문에, 2005년부터 2013년까지(책이 출간되지 않은 2009년은 제외)의 자료를 직접 코딩했다. 식당 이름과 주소, 전화번호를 기준으로 매칭한 결과 899곳을 확보했으며, 분석에는 SUR 회귀(여러 회귀식을 개별적으로 추정하지 않고 오차항 간의 상관관계를 반영해 동시에 추정하는 방법)를 사용했다.
세 번째 단계는 생존 분석이다. 폐업한 446곳을, 조건이 비슷하면서 계속 영업 중인 식당과 CEM(성긴 정확 매칭)이라는 방법으로 짝지었다. 짝을 짓는 이유는, 폐업한 식당과 영업 중인 식당을 그대로 비교하면 서비스 품질이 아닌 다른 요소의 차이까지 분석 결과에 섞여 들어가기 때문이다.
CEM은 별점·리뷰 수·가격대·요리 종류 같은 값들을 몇 개의 구간으로 나눈 뒤, 모든 구간이 동일한 칸에 속하는 식당끼리만 짝을 짓는 방식이다. 예를 들어 폐업한 식당이 “별점 3점대·리뷰 50건대·중간 가격대·이탈리안” 칸에 속한다면, 영업 중인 식당 중 같은 칸에 속한 곳을 짝으로 배정한다. 그 칸에 짝지을 상대가 없으면 해당 식당은 분석에서 제외된다. 조건이 비슷한 식당끼리 비교해야 텍스트 차원이 기여하는 몫을 가려낼 수 있기 때문이다. 이후 다음 분기에 폐업하는지를 종속변수로 설정해 패널 로짓 모형을 추정했으며, 입지·경쟁 강도·리뷰 길이·가독성을 통제했다. 또한 역인과관계(서비스 품질 저하가 원인이 아니라, 폐업이 먼저 결정된 뒤 그 여파로 리뷰의 서비스 품질 언급이 나빠지는 상황)의 가능성을 줄이기 위해 독립변수는 한 분기 앞선 시점의 값을 사용했다.
✔️ 연구 결과
매칭 결과를 요약하면, 폐업 식당 446곳 전체가 영업 중인 식당 605곳과 매칭되었다. 영업 중인 후보 2,021곳 가운데 짝으로 선정된 곳은 셋 중 하나꼴이었으며, 나머지는 폐업한 식당과 같은 칸에 속하는 곳이 없어 매칭에서 제외되었다. 두 집단은 평균 별점(3.26 대 3.31)과 리뷰 수(54.8건 대 59.5건)가 비슷해, 매칭이 적절하게 이루어졌다고 볼 수 있다. 최종 패널은 관측치 16,515개, 식당 1,035곳으로 구성되었다.
첫 번째 조건 — 특정 의미론적 차원이 강하게 나타나는 리뷰는 사람이 읽어도 그 차원의 내용으로 인식되는가. 참가자들은 전반적 품질·대기시간·응대성 세 차원에서 각각 93%, 90%, 85%의 정확도로 리뷰를 분류했다. 이는 무작위로 답했을 때(이항검정 기준 50%)보다 훨씬 높은 수치다. 다만 여기에는 저자들이 솔직하게 밝힌 한계가 있다. 이 정확도는 해당 차원에 대한 언급이 리뷰에서 뚜렷하게 나타났을 때의 결과이며, 언급이 희미하게(약하게) 나타난 리뷰를 보여줬을 때는 정확도가 떨어졌다. 특히 대기시간 차원은 우연 수준과 통계적으로 구별되지 않았다.
정리하면, 리뷰에 “대기시간이 너무 길어서 별로였어요”처럼 해당 내용이 명시적으로 서술되어 있지 않으면 참가자들은 이를 제대로 분류하지 못했다. 저자들은 이를 온라인 리뷰가 대체로 후한 방향으로 쏠려 있는 경향 때문이라고 설명한다. 5점 만점에 평균 별점이 4점을 넘다 보니, 리뷰에 뚜렷하게 서술된 신호는 사람들의 예상과 맞아떨어져 알아보기 쉽지만, 희미하거나 애매한 텍스트는 그 의미를 파악하기 어렵다는 것이다.
지금까지가 사람을 대상으로 한 검증이었다면, 애초에 이 검증 자체를 진행하지 못한 차원이 둘 있다. 음식 품질과 분위기다. 이 두 차원은 대학생을 대상으로 한 파일럿 실험 단계에서 참가자들이 구별하지 못해 본 실험에 포함되지 못했다. 그런데 저자들이 지목하는 실질적인 원인은 참가자가 아니라 모델 자체의 한계다. NMF는 리뷰에서 다섯 개의 축을 추출하는데, 이 두 차원은 네 번째와 다섯 번째로 추출된 축이다. PCA와 마찬가지로 순서가 뒤로 갈수록 설명하는 분산이 줄어들기 때문에, 이 두 차원은 상대적으로 판별력이 약했다. 실제로 두 차원의 대표 단어를 보면 food, good처럼 전반적 품질 차원과 겹치는 단어가 많다. 축 자체의 경계가 흐릿하다 보니 참가자들도 이를 구별하기 어려웠던 것이다. 다만 저자들은 음식 품질과 분위기가 서비스 품질의 요소로서 중요하지 않다는 의미는 아니라고 밝힌다.
두 번째 조건 — 텍스트에서 산출한 점수가 기존 평가와 비교해도 일관된 관계를 보이는가. Zagat 평가와 비교했을 때 시스템 전체의 R²는 0.65로 나타났다. 대응 관계도 상당히 뚜렷했다. 전반적 품질은 Zagat의 세 항목 모두와 상관관계를 보였고, 대기시간과 응대성은 Zagat의 서비스 항목과 대응되었다. 대기시간 쪽 계수가 음수(−2.99)로 나온 것은 앞서 방법론에서 설명한 바와 일치한다. 대기시간이 리뷰에서 화제가 될수록 전문가가 매긴 서비스 점수는 낮아졌다는 뜻이다. 음식 품질은 Zagat의 음식 항목과, 분위기는 인테리어 항목과 각각 대응되었다. 여기서 눈여겨볼 점은, MTurk 실험에서는 검증되지 못했던 음식 품질과 분위기 두 차원이 이 단계에서는 유의한 대응 관계를 보였다는 것이다.
세 번째 조건 — 그렇게 측정된 서비스 품질이 실제로 레스토랑의 생존 여부에 차이를 만들어내는가. 생존 분석 결과, 텍스트 차원들은 실제로 레스토랑의 폐업 여부와 유의한 관계를 보였다. 전반적 품질 차원의 점수가 높을수록 다음 분기에 폐업할 확률이 낮았고(p<0.001 — 우연히 이런 결과가 나올 확률이 0.1% 미만이라는 뜻이며, 네 개 모형 모두에서 일관되게 나타났다), 대기시간 차원의 점수가 높을수록 폐업 확률이 높았다(p<0.01). 앞서 대기시간 언급만으로는 서비스의 어느 한 측면만을 포착한다고 했는데, 이 결과는 그 한 측면만으로도 폐업 여부를 좌우할 만큼 실질적인 영향력을 갖는다는 뜻이다. 응대성은 p<0.1 수준에서 제한적으로만 유의했다.
여기서 눈에 띄는 것은 이 텍스트 차원들이 평균 별점보다 폐업 여부에 더 큰 영향을 미쳤다는 점이다. 모든 변수를 같은 척도로 맞춰 분석에 투입했기 때문에 계수 크기를 직접 비교할 수 있는데, 별점보다 텍스트에 더 많은 정보가 담겨 있다는 저자들의 주장을 데이터가 뒷받침한 셈이다. 숫자 변수만 사용한 기존 모형과 비교하면 모형 적합도는 AIC 기준 16%, BIC 기준 10% 개선되었고, 폐업 예측 정확도는 70%만큼 향상되었다. 반면 음식 품질과 분위기는 어느 모형에서도 유의하지 않았다.
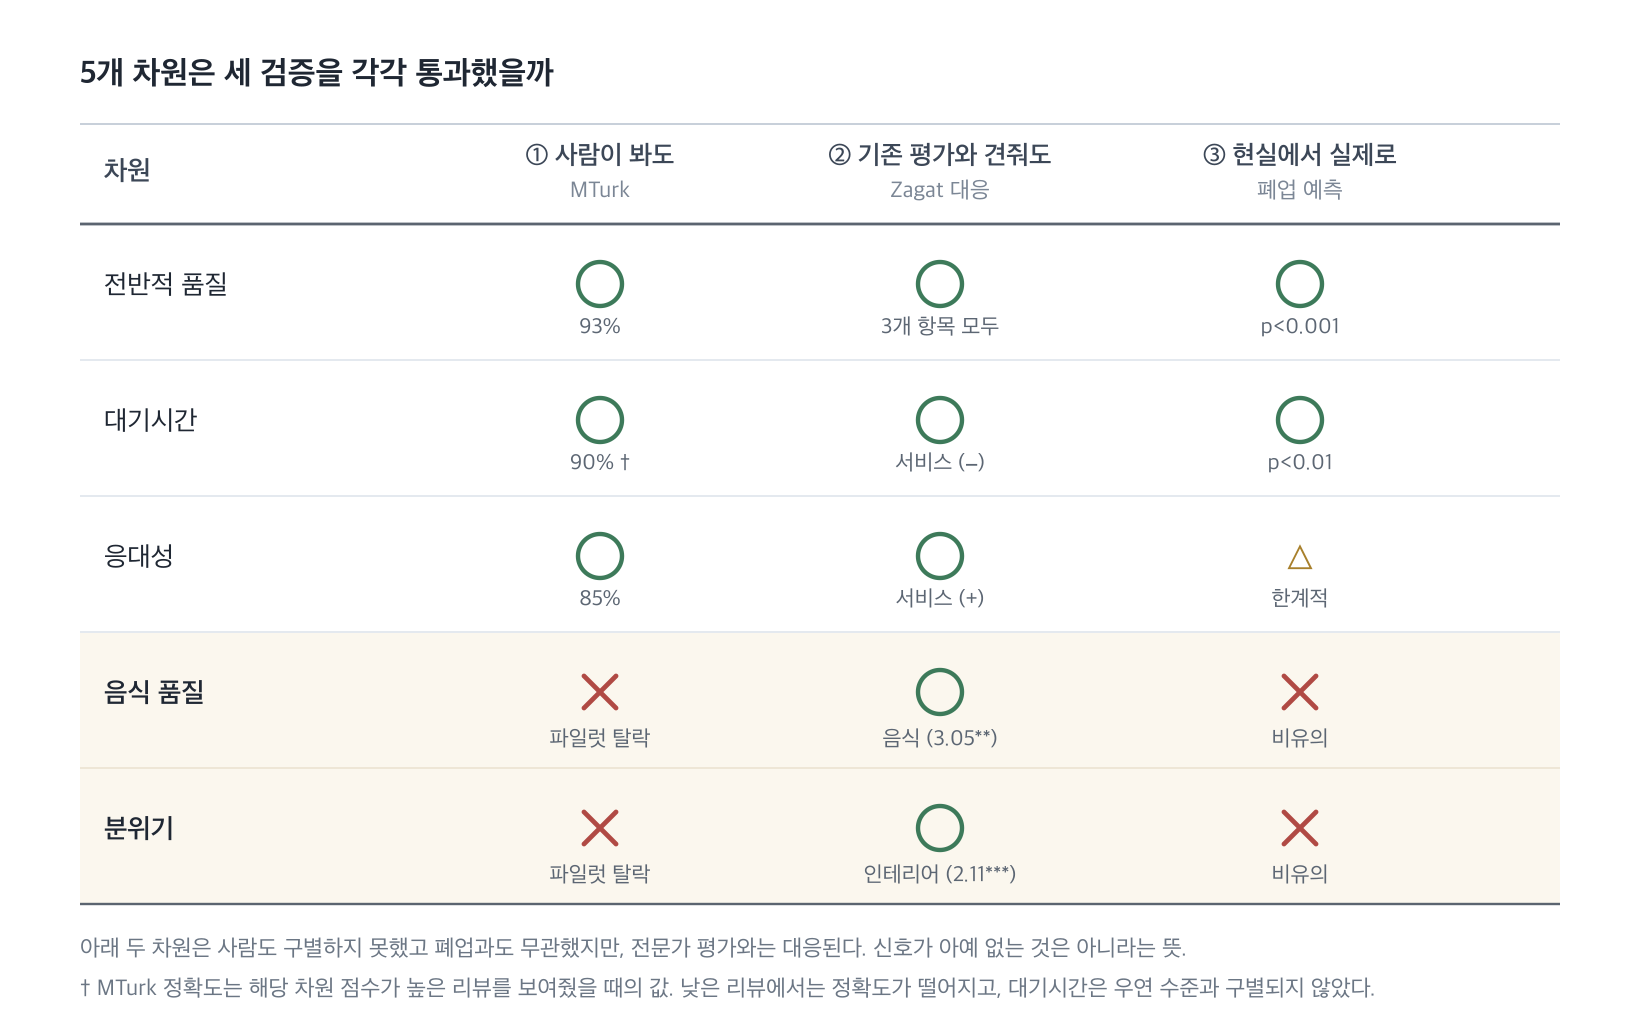
그림 3. 5개 차원이 세 조건을 각각 통과했는지 정리한 표.
저자들은 이와 반대 방향의 설명 가능성도 점검한다. 서비스 품질 저하가 폐업으로 이어진 것이 아니라, 폐업을 결정한 이후 매장 운영에 소홀해지면서 서비스 품질이 뒤늦게 나빠졌을 가능성이다. 저자들은 이를 확인하기 위해 전미레스토랑협회 관계자들을 인터뷰해, 폐업을 결정한 업주 대부분이 최대한 신속하게 영업을 종료한다는 사실을 확인했다. 실제 데이터에서도 폐업 1.5개월 전까지는 품질 점수가 평평하게 유지되는 것으로 나타났다. 여기에 더해, 리뷰어 수백 명이 각자 독립적으로 작성한 글이므로 이들 모두가 폐업을 예감하고 리뷰를 남겼을 가능성은 낮다는 논리도 함께 제시한다. 견고성 검증 역시 폭넓게 이루어졌다. 폐업 시점을 생존 시간 자료로 다루는 Cox 비례위험모형, 다른 매칭 방법, 식당 개업 연수 통제, 분기 대신 6개월 단위 재추정, 더 긴 시차를 적용한 재추정 등을 통해 결과가 일관되게 유지됨을 확인했다. 다만 저자들은 이 결과가 인과관계를 입증하는 것은 아니라는 점을 분명히 밝힌다.
✔️ 결론
이 논문은 업종에 매이지 않고 서비스 품질을 대량으로 측정하는 방법을 제시하고, 그렇게 측정한 값이 폐업이라는 결과와 실제로 연관된다는 것까지 확인했다. Yelp 리뷰 텍스트에 NMF를 적용해 서비스 품질을 다섯 개 차원으로 추출하고, 이를 MTurk 실험과 Zagat 평가라는 서로 다른 두 경로로 검증한 뒤, 마지막으로 2005~2013년 워싱턴 D.C. 레스토랑의 폐업 데이터와 연결했다. 그 결과 별점 하나만으로는 포착되지 않던 정보가 텍스트 차원에 서술되어 있었고, 이 정보는 폐업 여부를 예측하는 데도 유의미하게 기여했다. 전미레스토랑협회 보고서의 표현을 빌리면 “온라인 리뷰는 사업을 살릴 수도, 무너뜨릴 수도 있다”는 것인데, 이 논문은 그 주장을 데이터로 뒷받침한 셈이다.
정리하면 이 논문은 서비스 품질을 대량으로 측정하는 문제와, 그 측정치를 기업의 실제 성과와 연결하는 문제를 함께 다루었다. 이것이 의미를 갖는 이유는 서비스 품질 연구에서 이 두 가지가 오랫동안 충분히 다뤄지지 않았기 때문이다. 설문이나 대기시간 같은 기존 지표는 정확할 수 있지만 업종을 넘나들며 대량으로 반복하기 어려웠고, 서비스 품질을 개별 프로세스 성과와 연결한 연구는 많았어도 레스토랑의 생존 여부처럼 기업 전체의 명운과 연결한 연구는 드물었다.
다만 이 논문이 모든 물음에 답한 것은 아니며, 저자들 스스로도 한계를 분명히 밝힌다. 매출 자료가 없어 폐업이라는 다소 극단적인 결과 변수에 의존할 수밖에 없었고, 이번 분석은 NMF라는 특정 토픽 모델링 기법에 기반하고 있어 다른 방법으로도 같은 질문을 검증해 볼 여지가 남아 있다.
그럼에도 이 논문의 실무적 함의는 분명하다. 레스토랑 운영자는 이 방법을 통해 자신의 서비스 요소 중 무엇이 부족한지 경쟁사와 비교해 볼 수 있고, 재무 정보에 접근하기 어려운 투자자나 건물주도 업체의 현재 상태를 가늠하는 데 이를 활용할 수 있다는 것이 저자들이 강조하는 바다. Yelp 같은 플랫폼이라면 별점 하나 대신 이런 차원별 점수를 제공하는 방식도 고려해 볼 수 있을 것이다.
✏️ 읽고 나서
읽는 동안 ‘텍스트마이닝’ 수업에서 다루었던 프로젝트가 계속 떠올랐다. 설문 대신 인터넷 게시글과 댓글을 모아 여론을 측정하려던 프로젝트였는데, 발상 자체는 이 논문과 거의 같았다. 차이가 있다면, 이 논문은 추출한 지표가 실제로 성과를 측정하고 있는지를 훨씬 집요하게 검증한다는 점이다. 나는 크롤링 이후 별다른 검증 없이 프로젝트를 끝냈지만, 이 논문은 사람에게 직접 물어보고, 전문가 평가와 대조하고, 폐업 여부까지 연결해 확인한다. 이 부분이 가장 배울 만한 자세였다.
궁금한 점도 남는다. 워싱턴 D.C. 한 도시에서 추출한 다섯 개 차원이 뉴욕이나 지방 소도시에서도 그대로 나타날까? 대기시간에 대한 민감도만 하더라도 도시마다 다를 가능성은 없는가? 결국 한 지역에서 도출한 결과가 다른 지역에서도 통용되는지를 묻는 질문인 셈인데, 어떤 환경에서 학습한 모델이 다른 환경에서도 통용되는지는 최근 딥러닝 분야에서 도메인 일반화(domain generalization)라는 이름으로 따로 다루는 문제다. 분야는 달라도 비슷한 고민을 하고 있다는 점이 반가웠다.
📎 참고 자료
이 글에 나온 용어와 자료를 더 보고 싶은 분들을 위해.
SERVQUAL — 이 글에서 “전통적인 설문 방식”의 대표로 든 도구. 손님이 서비스에 기대했던 수준과 실제로 받았다고 느낀 수준의 격차를 22개 문항으로 재고, 결과를 유형성·신뢰성·응답성·확신성·공감성 다섯 가지로 정리한다. 1988년에 나온 뒤로 서비스 품질 측정의 표준처럼 쓰여 왔다.
Parasuraman, A., V. A. Zeithaml, and L. L. Berry. “SERVQUAL: A Multiple-Item Scale for Measuring Consumer Perceptions of Service Quality.” Journal of Retailing 64(1) (1988): 12–40. semanticscholar.org
PCA(주성분 분석) — 변수가 많을 때 서로 얽힐 정보를 몇 개의 대표 축으로 압축하는 기법. 이 논문이 쓴 NMF는 여기에 “모든 값이 0 이상이어야 한다”는 조건을 더한 것이다.
CEM(성긴 정확 매칭) — 변수 값을 몇 개 구간으로 뭉뚱그린 뒤 같은 칸에 들어가는 것끼리만 짝짓고, 짝이 없는 건 버리는 매칭 기법.
Iacus, S., G. King, and G. Porro. “Causal Inference without Balance Checking: Coarsened Exact Matching.” Political Analysis 20(1) (2012): 1–24. doi.org/10.1093/pan/mpr013
Zagat — 이 글에서 비교 상대로 쓰인 업계 표준 평가. 익명 자원자들의 설문을 지역 음식 평론가인 편집자가 취합해 음식·인테리어·서비스 세 항목에 30점 만점으로 점수를 매기는, 미국의 대표적인 크라우드소싱 기반 레스토랑 평가 매체다. 논문이 다룬 2005~2013년에는 책 형태로만 나왔다.