When Does a Digital Disruption Strategy Actually Pay Off? 디지털 디스럽션 전략은 언제 통할까?
Sting et al. (2024) · MIS QuarterlySting et al. (2024) · MIS Quarterly
Sting, Fabian J., Murat Tarakci, and Jan Recker (2024). Performance Implications of Digital Disruption in Strategic Competition. MIS Quarterly 48(3):1263–1278.
✔️ Introduction and Summary
The paper covered in this issue asks how much a firm should invest in digital technology to secure a competitive edge.
Start with the two strategies the paper distinguishes. Digital disruption means using digital technology in a new way to overturn the assumptions an industry has taken for granted. It isn’t something that collapses on its own — it refers to a firm deliberately breaking the existing order. Netflix is the classic example. Renting a movie used to require a rental store and a video tape. Netflix stripped away these physical elements and rebuilt the value chain around streaming and recommendation algorithms. As a result, what counted as “a good movie service” changed entirely — the standard shifted from having a nearby store with a full inventory to being available anytime with recommendations that fit. The strategy that stands in contrast to this is adaptation: keeping the existing approach in place and simply adding digital elements on top of it, the way a rental store might stay open while adding an online reservation feature.
This paper uses two companies in the Australian retail market as its case. Woolworths is Australia’s large supermarket chain, and Amazon Australia is the online retailer that entered the Australian market in 2017. Woolworths kept its stores and logistics system as they were and added online ordering and delivery — an adaptation strategy. Amazon, by contrast, wasn’t bound by physical constraints like stores, and redesigned logistics, recommendations, and delivery from the ground up — a digital disruption strategy.
Compare the two companies’ 2022 net online sales. Woolworths brought in $4.05 billion; Amazon Australia, $2.6 billion. By absolute sales volume, Woolworths is ahead. Woolworths’ sales also grew 29.1% year over year, so it’s been growing steadily by its own past standard. But Amazon’s sales growth rate came in 23.8 percentage points higher than Woolworths’. In other words, the gap between the two companies is gradually narrowing. The authors distinguish these two perspectives as absolute performance and relative performance, respectively: absolute performance is the absolute level a firm has reached, while relative performance is the gap with a competitor.
✔️ Research Content and Logic
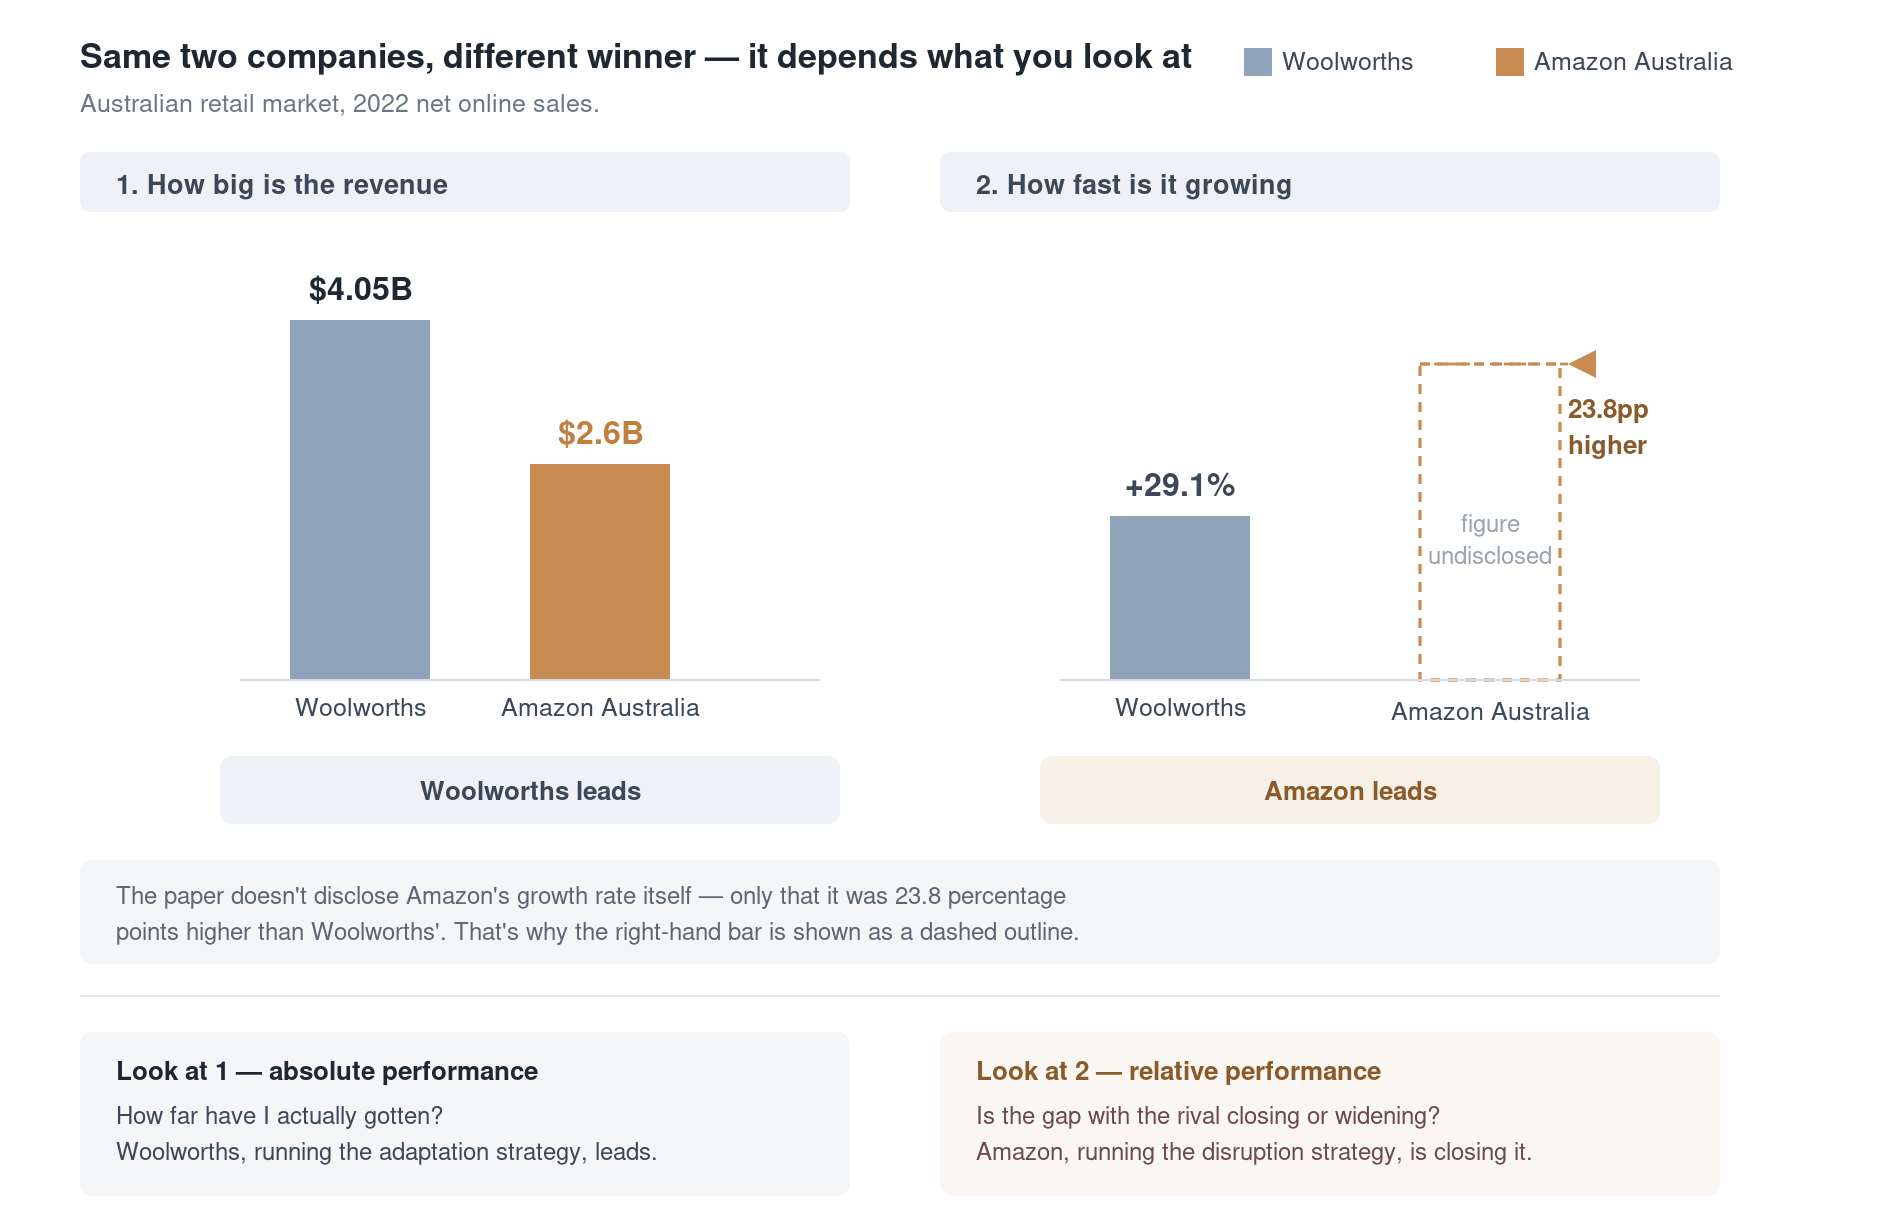
Figure 1. Who’s winning? 2022 net online sales, Australian retail market. By scale, Woolworths leads; by growth rate, Amazon leads.
So which strategy is better? That’s a question hard to verify from real company cases alone, because there’s no way to know anywhere what would have happened if Woolworths had reorganized its value chain the way Amazon did — a firm only gets to live through one history. That’s why the authors turn to simulation. This is where the paper’s idea gets interesting: it applies a model built in biology to explain evolution to competition between firms. Picture a landscape made of peaks and valleys, and place a firm on it as something that moves around looking for a higher point. In this framework, adaptation is the process of gradually moving to a higher spot on the current landscape, while digital disruption is the process of redrawing the landscape itself.
The short version of the result: digital disruption helps a firm get ahead of its rival, but it can end up eating into the firm’s own performance. And there’s a zone where, under the exact same circumstances, the best choice flips entirely depending on what the firm is aiming for.
Digital disruption is talked about in management discourse these days almost as if it were the obvious right answer. Similar things happened not just with Netflix but in the music and publishing industries too, and these cases are so widely known that they’ve shaped conventional wisdom. But what the authors point out is that most of the cases we know are, by definition, successes. Plenty of attempts to reorganize a value chain digitally have failed, but those cases don’t become well known. Looking only at the successful cases makes digital disruption look like it’s always the right choice. What we actually need to know is when digital disruption works and when it doesn’t — and success stories alone can’t sort that out.
The authors also see a gap in existing research. Studies so far have largely judged a single firm at a time — whether it’s the firm that reorganized its value chain or the firm affected by it, the focus has stayed on one side, explaining what capabilities that firm had and how it used technology. But when one firm reorganizes its value chain, it isn’t just that firm’s performance that changes — the range of strategies available to other firms changes too. As the Australian retail market absorbed Amazon’s new approach, the very standards for customer demand, order fulfillment, and performance evaluation shifted, and Woolworths had to choose its strategy again on this changed footing. So looking at a single firm like Amazon alone can’t tell you whether its choice was actually the right one — that’s the authors’ critique.
As noted above, this is hard to verify with real data alone. So the authors use simulation to build a setup where two firms interact simultaneously. This paper asks two questions. First, what performance trade-off exists between digital disruption and adaptation? Second, under what conditions should a firm choose digital disruption, and under what conditions should it not?
✔️ Data and Methodology
This paper has no real company data. Instead, it builds a hypothetical competitive situation inside a computer and runs it. This method is called simulation.
In industrial engineering, problems are generally solved along two broad paths. One is optimization: formalize the objective and constraints as equations, then compute the single best answer under those conditions — a clear-cut answer like “allocate production this way and cost is minimized.” But optimization doesn’t always work well. It struggles when relationships are too tangled to be captured in equations, when chance plays a large role, or when your best move keeps changing depending on how your rival responds.
The situation this paper deals with fits exactly this description. Decisions are entangled with one another, whether the market will accept a new approach can only be expressed as a probability, and the best answer flips depending on what the rival does. This is where simulation comes in. Instead of computing the answer directly, you build a model and actually run it — give a hypothetical firm a set of rules, let it choose strategies over a fixed period, and observe the outcome. A single run is heavily at the mercy of chance, so the same simulation is repeated many times under each condition and averaged.
The character of the resulting answer differs accordingly. Where optimization says “this is the correct answer,” simulation is closer to saying “under these conditions, this is generally what tends to happen.” What this paper presents, too, is less a verified fact than a tendency confirmed repeatedly across a range of conditions.
The NK model — what it is and why this framework was borrowed
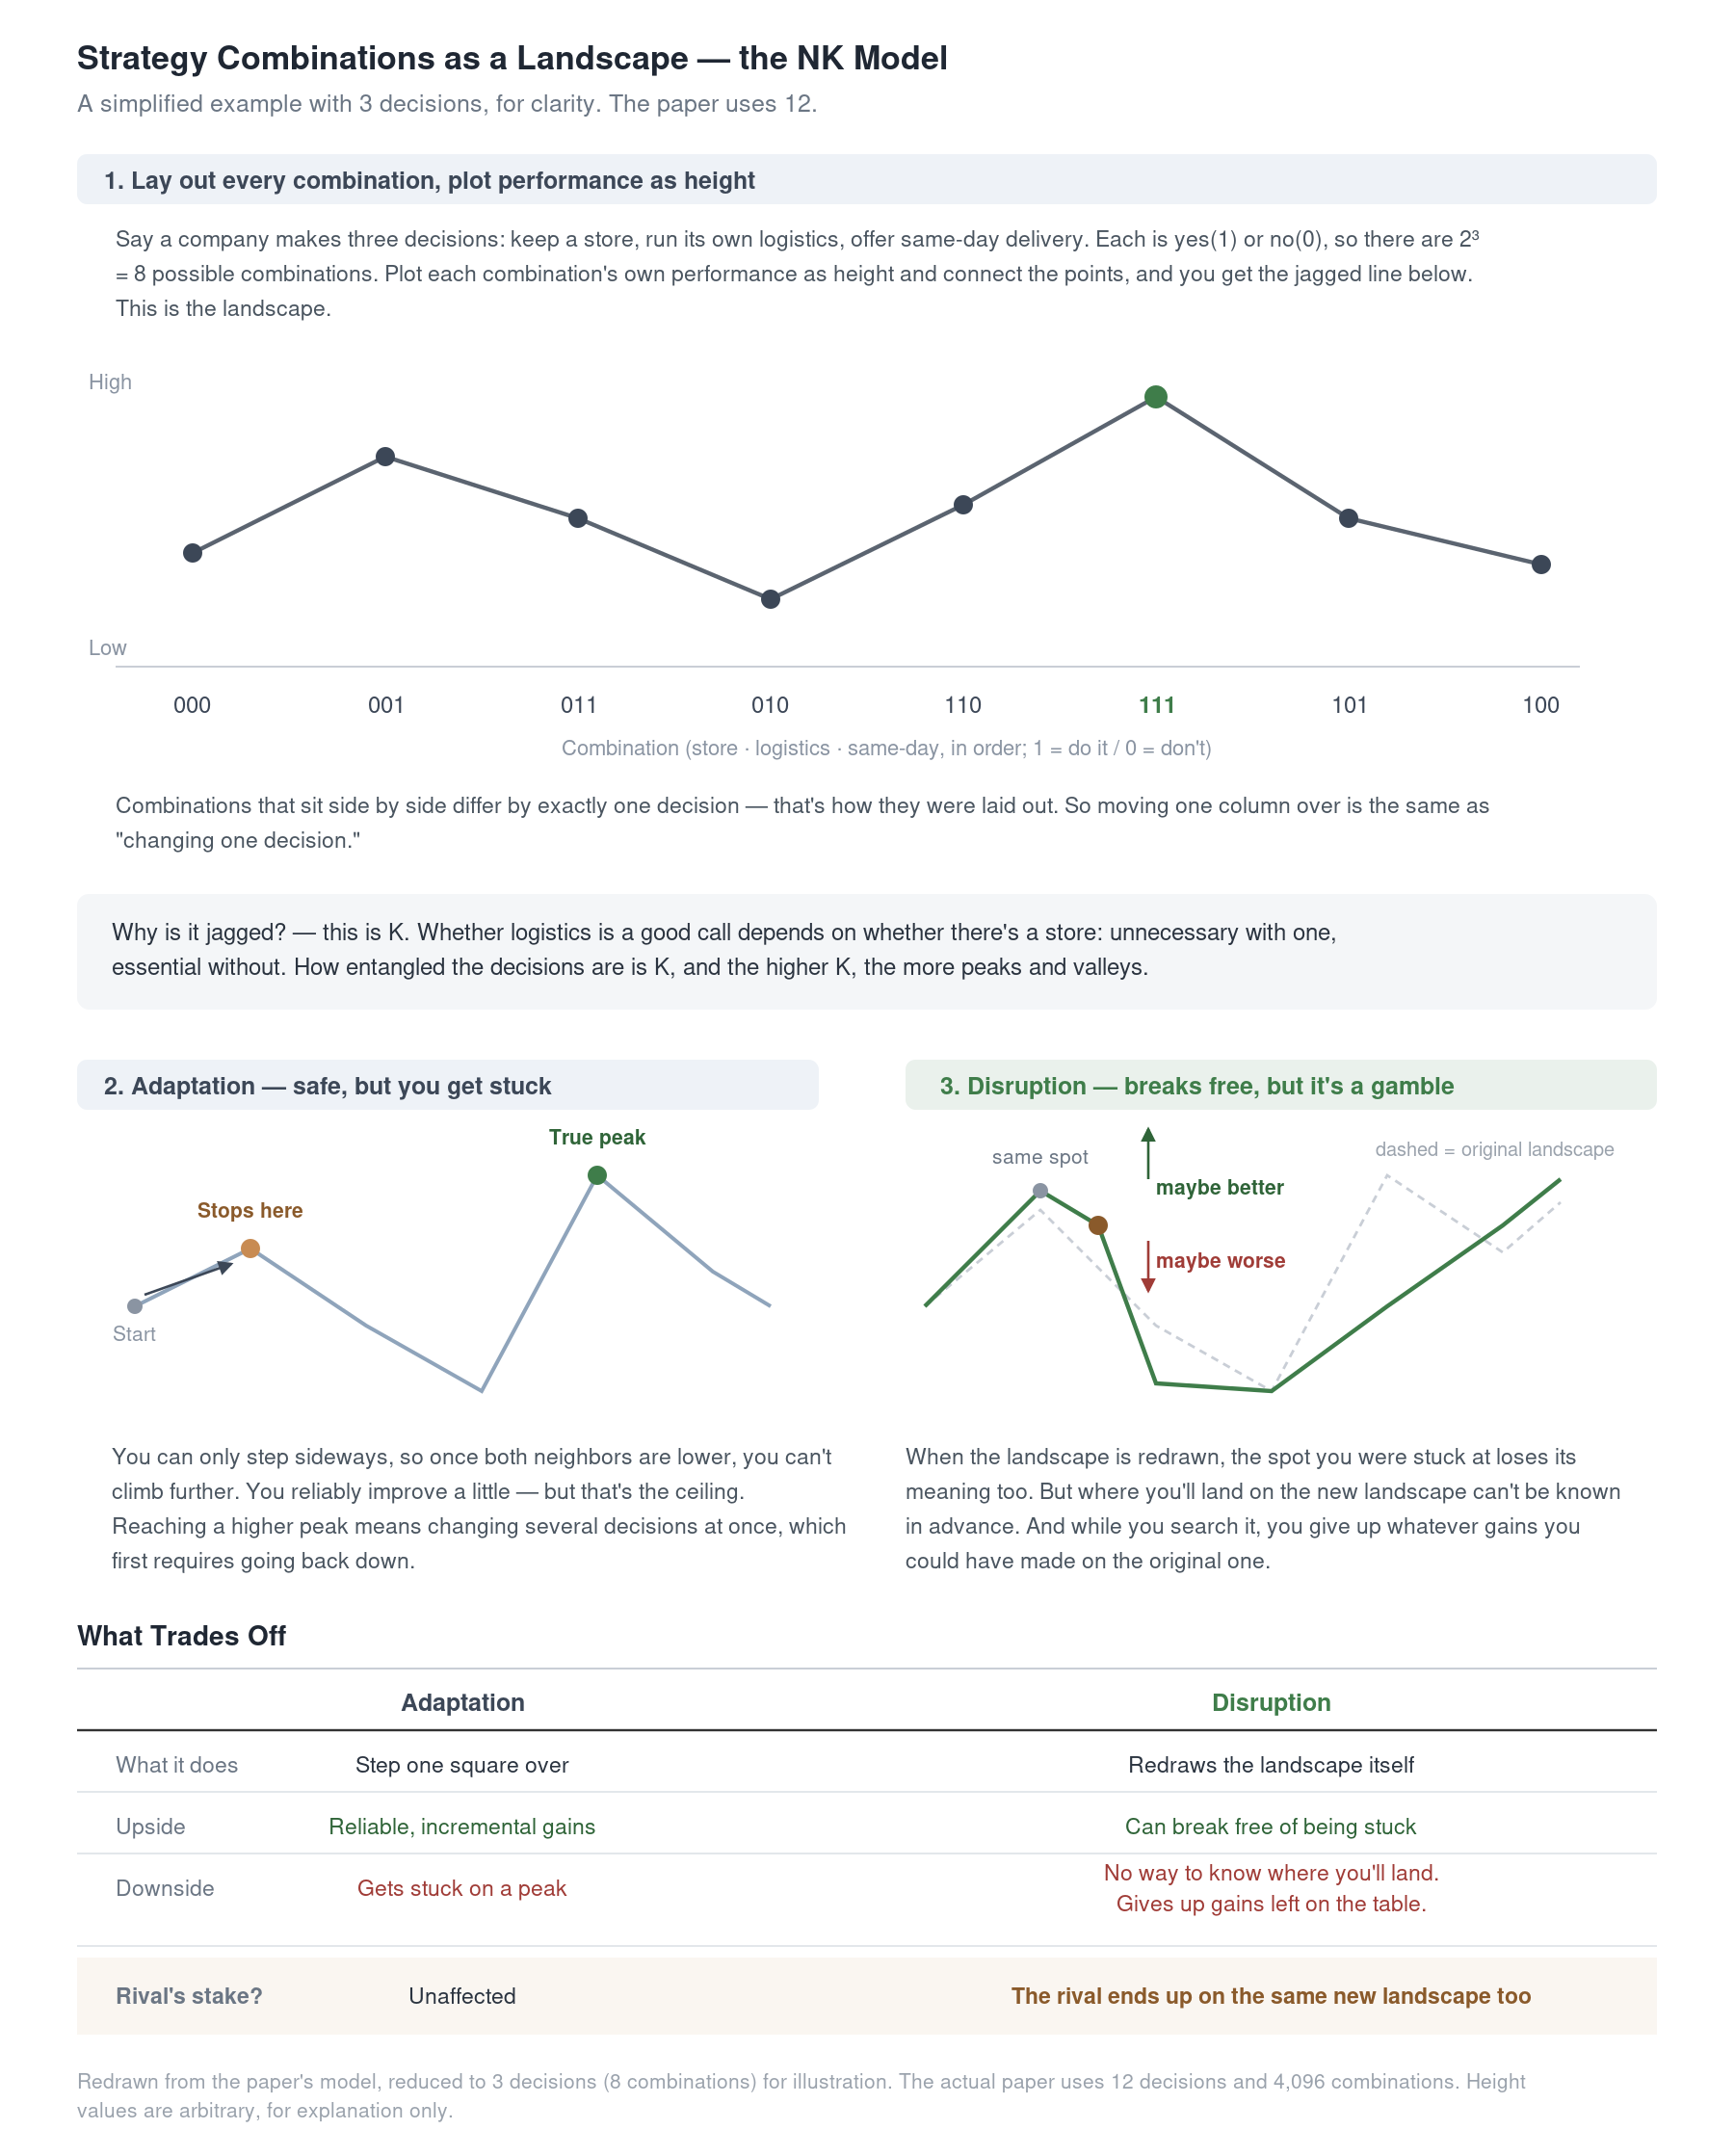
Figure 2. An example reducing a firm’s strategic choices to 3 decisions to show the combination space as a landscape. Adaptation moves one square over at a time; digital disruption redraws the landscape itself.
The simulation framework the authors use is the NK model, devised in 1993 by biologist Stuart Kauffman, originally to explain biological evolution. Kauffman’s question was this: an organism’s traits are produced jointly by multiple genes, and when those genes influence one another, why is finding a good combination so difficult? To answer this, he introduced the concept of a fitness landscape — placing every possible combination as a point on a map, with the height of that point representing how good the combination is. This produces a landscape made of peaks and valleys, and the organism becomes something that moves across it a little at a time, searching for a higher point.
The model’s name comes from the two numbers that determine the shape of this landscape. N is the number of decision elements, and K is how entangled those elements are with one another. The reason this framework also applies to corporate strategy is that a firm’s strategic decision-making has the same structure — a firm, too, makes multiple decisions at once, those decisions influence one another, and the firm adjusts them little by little in search of a better combination. That’s why the NK model has long been used in strategic management research.
Where this paper sets itself apart from existing research is at one point: in past research, the landscape was fixed. A firm only moved around on it; the landscape itself never changed. This study assumes that a firm’s actions can change the landscape itself, and reproduces this through simulation. Digital disruption is exactly that. What was described earlier as “the very standard for good performance changes” is translated in this model into “the landscape gets redrawn.”
Working through the model. First, a firm’s strategy is broken down into N decisions, each taking a value of 0 or 1 — a placeholder representing choices like whether to keep a store or not, or whether to run in-house logistics or not. A single firm’s state is represented as a vector of these decisions:
The paper sets N to 12. The number of possible combinations is 2¹² = 4,096, and these 4,096 combinations correspond to each point on the landscape.
How much each decision contributes to performance is denoted π. A firm’s overall performance is the average of these contributions, and this average becomes the height at that position. Written as an equation:
In words, a firm’s performance Π is the average of the contribution πm that each of the N decisions makes. But each contribution πm isn’t determined by that one decision (dm) alone — it also depends jointly on the other decisions (d−m). In other words, a firm’s performance isn’t a simple sum of individual decisions, but a value produced by how the decisions are entangled with one another.
What’s worth noting here is d−m, inside π’s parentheses. The contribution of the m-th decision depends not only on its own value (dm) but also on the other decisions (d−m). For instance, whether running in-house logistics is a good choice can depend on whether the firm also keeps a store. How many other decisions it depends on is given by K, and the paper sets K to 6. K determines the overall shape of the landscape. If K is 0, the decisions are independent of one another, so simply changing each one to a better option, one at a time, is enough to reach the peak — a landscape made of a single smooth hill. If K is large, on the other hand, changing one decision shakes up the contributions of the other decisions as well. The result is a landscape where peaks and valleys are complexly intermixed, and standing on the peak right in front of you offers no guarantee that it’s the highest point overall.
The two strategies diverge on this landscape. Adaptation is the process of changing decisions one at a time on the current landscape in search of a higher point. Digital disruption, by contrast, is the process of changing the performance function itself, from Π to Π′. The newly created performance function keeps the same form — Π(d) = (1/N)Σπm(dm, d−m) — but differs in that every contribution value π′m inside it is reset from scratch. As a result, the locations of every peak and valley change entirely.
Strategy is expressed as a ratio. How much of its resources a firm commits to digital disruption is written as α. α = 0 is a purely adaptive strategy; α = 1 is a purely digital-disruption strategy. A distinguishing feature of this paper is that it treats this not as a binary choice between the two, but as a question of how to allocate resources.
Whether the new landscape actually takes hold is decided by the market. Reorganizing a value chain doesn’t mean the market accepts it right away. The probability the market accepts it is written as ρ, and the paper analyzes both a low case (0.1) and a high case (0.9) — a value meant to comprehensively capture various factors such as regulation or how digitally ready an industry is.
This model analyzes two firms at once, because a firm’s best choice depends on its rival’s strategy. Still, what’s being analyzed remains the performance of an individual firm — it isn’t summing the two firms’ performance together or measuring industry-wide profit.
Performance is measured in two ways. Absolute performance is the height a firm has reached at the final period, and relative performance is the difference in height between the firm and its rival. Written as an equation:
Absolute performance is the height firm i has reached at the final period T — that is, Πi(diT) itself. Relative performance ΔΠi subtracts the rival’s height Πj(djT) from that. If relative performance is greater than 0, the firm is ahead; if it’s less than 0, the firm is behind.
The two firms execute their strategies simultaneously over 50 periods, and the simulation is repeated 10,000 times per condition and averaged. Gathering the variables that have appeared so far in one place:
| Symbol | Meaning | Value |
|---|---|---|
| N | Number of strategic decisions a firm makes | 12 |
| K | How many other decisions each one is entangled with (how jagged the landscape is) | 6 |
| d | The firm’s current position (its combination of decisions) | 0/1 vector |
| π | How much a single decision contributes to performance | assigned at random |
| Π | The firm’s performance = average of the π’s = height on the landscape | computed |
| Π′ | Performance on the landscape redrawn by digital disruption | computed |
| α | Share of resources committed to digital disruption | 0–1 |
| ρ | Probability the market accepts the new landscape | 0.1 or 0.9 |
| T | Simulation horizon | 50 |
✔️ Findings
First question: what’s the trade-off in absolute performance?
When the market doesn’t readily accept the new approach (ρ = 0.1) and the rival also stays with an adaptation strategy, maximizing the firm’s own performance means committing only a small share of resources to digital disruption (α ≈ 0.2). In this range, the performance curve takes the shape of an inverted parabola — a small commitment raises performance, but performance actually worsens as the commitment grows larger. The authors interpret this small-scale investment as a kind of option: keeping open the possibility of changing the game, while only fully executing it once it’s judged to be genuinely advantageous. Committing all of one’s resources, by contrast, carries a large opportunity cost — if the firm fails to find a better position on the new landscape, it has to return to its original position, having given up, in the meantime, whatever performance it could have gained by staying on the original landscape.
Under the same conditions, the picture changes once the rival moves to reorganize its value chain. In that case, the best move is to all but abandon digital disruption (α ≈ 0). With the rival already causing turbulence in the market, there’s no reason for the firm to add further turbulence of its own.
When the market readily accepts the new approach (ρ ≈ 0.9), the scale tips toward digital disruption — but only while the rival stays with an adaptation strategy. In this case, the best approach is to pursue adaptation and digital disruption together in appropriate measure (α ≈ 0.8): a strategy that both leans into the high likelihood the new landscape will take hold and captures the gains still available on the existing landscape. But even here, once the rival moves to reorganize, the performance curve keeps falling, and ultimately concentrating on adaptation alone (α ≈ 0) becomes the best choice.
Second question: what results emerge for relative performance? Here, the picture changes.
When the market doesn’t readily accept the new approach, a similar conclusion holds: digital disruption is best attempted only at a moderate level (α ≈ 0.3). What’s interesting is that when the rival moves to reorganize its value chain, the firm’s own relative performance actually improves. While the rival makes an investment that yields no gain and forfeits whatever benefit it could have captured on the existing landscape, the gap between the two widens in the firm’s favor.
When the market readily accepts the new approach, however, the result flips entirely. The performance curve keeps rising, and committing all of one’s resources becomes the best choice — even when the rival is doing exactly the same thing. If reorganizing the value chain succeeds, one of two things is bound to happen — the firm’s own performance rises, or the rival’s performance falls — and relative performance measures precisely that gap.
This is how a zone emerges where the best choice flips to its exact opposite depending on the goal, even under the same circumstances. When the market is open and the rival is reorganizing its value chain, protecting the firm’s own absolute performance means concentrating entirely on adaptation (α = 0), while getting relatively ahead of the rival means committing all of one’s resources (α = 1). What performance goal a firm sets leads to exactly opposite prescriptions.
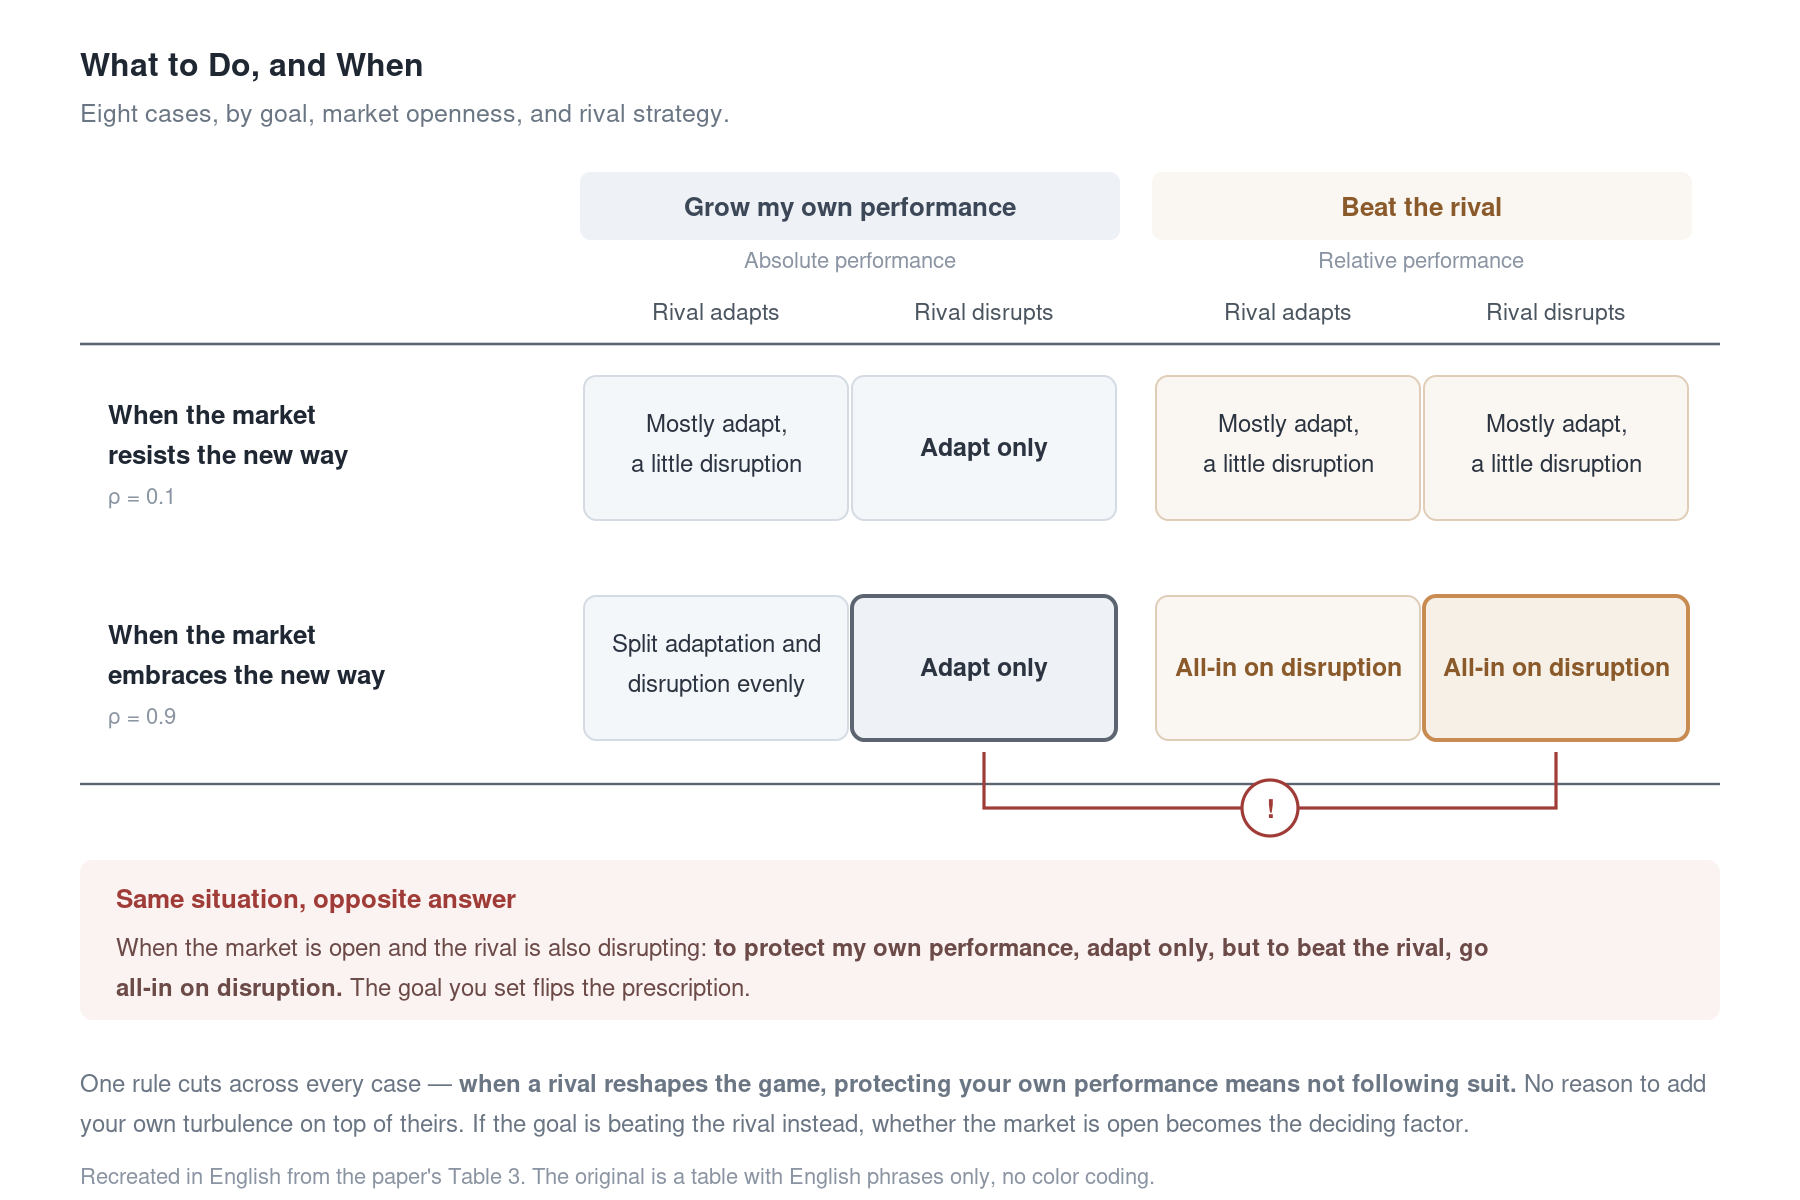
Figure 3. The optimal strategy by situation. Summarizes the eight cases that arise depending on the performance goal, market openness, and the rival’s strategy, with the cells where the best strategy flips highlighted. (Color key: gray/blue tones = Woolworths / adaptation / absolute performance; orange tones = Amazon / digital disruption / relative performance; red = where the optimal strategy flips.)
The authors verified broadly that this result isn’t a fluke. They re-checked it while varying the number of strategic elements (N) from 10 to 16, the landscape’s complexity (K) from 4 to 8, and the observation period from 10 to 1,000. They also tried setting the new landscape to overlap roughly half of the existing one, and tried changing the way the market accepts the new landscape so that it scales with performance. The conclusion held up in every case. That said, it’s worth noting that this is, after all, verification within the model itself — it means the same conclusion emerges even when the settings change, not that this has been shown to hold in reality.
✔️ Conclusion
This paper showed that a strategy of digitally reorganizing a value chain can turn into exactly the opposite prescription depending on what performance goal it’s aimed at. It helps a firm get ahead of its rival, but it can end up eating into the firm’s own absolute performance, and the best choice depends on whether the market is ready to accept it and on how the rival responds.
What makes this result matter is that, up to now, the way this problem has been looked at has largely been fixed on a single firm. The focus has stayed on explaining what capabilities the firm that reorganized its value chain had, or why the firm affected by it failed to respond. But when one firm reorganizes its value chain, the options available to other firms change as well, so leaving out how the rival responds leaves the discussion only half complete. The authors fill this gap by placing two firms on the same landscape and having them respond to each other’s strategies.
The authors themselves are clear about the limitations. Since the goal of this research is to build theory rather than to empirically verify it, testing it against real data remains a task for future work. And because this paper deals with a situation where two firms compete, there’s also room to extend the discussion to a wider range of industries where competition and cooperation coexist.
Even so, the significance of this paper is clear. What the authors particularly emphasize is that a drop in performance shouldn’t be read as failure right away. While a firm’s own absolute performance is stalling, the gap with its rival may still be widening, and that gap can later push the rival back and translate into an improvement in absolute performance. In the end, the authors’ message is that one needs to check whether what was set as the goal and what is used to judge success or failure have quietly come apart. The authors have also released a web tool that lets readers run this simulation for themselves.
✍️ After Reading
Reading this brought back my optimization coursework. Getting stuck on the peak right in front of you on a jagged landscape is what I learned as a local optimum, and this paper’s landscape is exactly that. In class, escaping it sometimes meant deliberately moving in a direction that worsened performance for a while, or jumping to a distant point. But this paper’s digital disruption isn’t a jump — it’s closer to redrawing the landscape itself. It was interesting to see that this kind of approach can also exist for the same problem.
I’ll admit the NK model didn’t click for me at first. But once I reduced the decision elements to three and drew out the eight possible combinations by hand, it made things much easier to understand. The paper uses twelve elements, which produces 4,096 combinations — reduce it to three, and you can check every case with your own eyes.
One question lingers, though. In this model, a firm can set its own α, while the market’s openness ρ is treated as a given value. But how many firms in the real world actually know this value precisely? It doesn’t seem likely that Woolworths moved forward having decided in advance, “we’ll go with α = 0.2.” As clean as the model is, how to actually estimate these values in the real world seems to remain an open task. The authors seem to share this concern too, since they note that empirical verification is left for future work. Going forward, I’d like to think about, whenever I get stuck at a local optimum in a problem I’m working on, whether to change the search method or to change the definition of the problem itself.
📎 References and Further Reading
For anyone who wants to dig further into the terms and materials mentioned in this piece:
- The paper covered in this issue — the full text is available through the authors’ institutional repositories. A free copy is hosted by the University of Hamburg repository; the publisher page is above.
- The authors’ public simulation tool — lets you run this paper’s simulation yourself, changing conditions to see how the results shift. Useful for getting a feel for where the paper’s conclusions actually come from.
- NK model — the simulation framework this paper uses. Originally built in evolutionary biology to explain how genes interact, and since applied widely in strategy research. N is the number of decision elements; K is how entangled they are with each other. Kauffman, S. A. The Origins of Order: Self-Organization and Selection in Evolution. Oxford University Press, 1993. NK model (English Wikipedia)
- Value chain — the chain of activities, from bringing in raw materials to making, selling, and servicing a product, through which a firm creates value. In this paper, adaptation layers digital onto this chain; digital disruption rebuilds the chain itself. Value chain (Wikipedia)
- Local optimum — a point that’s higher than its surroundings but not the highest point overall. Mentioned in the reflection above; it’s exactly the situation of getting stuck on a peak in this paper’s jagged landscape.
Sting, Fabian J., Murat Tarakci, and Jan Recker (2024). Performance Implications of Digital Disruption in Strategic Competition. MIS Quarterly 48(3):1263–1278.
✔️ 소개 및 요약
이번 이슈에서 다룰 논문은 기업이 경쟁 우위를 확보하려면 디지털 기술에 자원을 어느 정도 투입해야 하는지를 다룬다.
먼저 이 논문이 구분하는 두 가지 전략을 알아야 한다. 디지털 디스럽션은 디지털 기술을 새롭게 활용해 그 산업에서 당연하게 여겨지던 방식 자체를 뒤엎는 전략을 말한다. 무언가 저절로 무너진다는 뜻이 아니라, 한 기업이 의도적으로 기존 질서를 깨뜨리는 전략을 가리킨다. 넷플릭스가 대표적인 예다. 예전에 영화를 빌려 보려면 대여점이 있어야 하고 비디오테이프가 있어야 했다. 넷플릭스는 이런 물리적 요소를 걷어내고 스트리밍과 추천 알고리즘을 중심으로 가치사슬을 새로 구성했다. 그 결과 “좋은 영화 서비스”의 조건 자체가 달라졌다. 매장이 가깝고 재고가 많은 것에서, 언제든 볼 수 있고 추천이 잘 맞는 것으로 기준이 옮겨간 것이다. 이와 대비되는 전략이 적응이다. 기존 방식은 그대로 유지한 채 그 위에 디지털 요소를 더하는 것이다. 대여점이 문을 닫지 않은 채 온라인 예약 기능을 추가하는 식이다.
이 논문은 호주 소매시장의 두 기업을 사례로 든다. Woolworths는 호주의 대형 슈퍼마켓 체인이고, 아마존 호주는 2017년 호주 시장에 진출한 온라인 소매업체다. Woolworths는 매장과 물류체계를 그대로 유지한 채 온라인 주문과 배송 기능을 추가했다. 적응 전략에 해당한다. 반면 아마존은 매장 같은 물리적 제약에 얽매이지 않고 물류와 추천, 배송을 처음부터 새로 설계했다. 디지털 디스럽션 전략에 해당한다.
2022년 두 기업의 온라인 순매출을 비교해 보자. Woolworths는 40억 5천만 달러, 아마존 호주는 26억 달러였다. 절대적인 매출 규모로 보면 Woolworths가 앞선다. Woolworths의 매출 역시 전년 대비 29.1% 증가해, 과거 자신의 실적과 비교하면 꾸준히 성장하고 있다. 그런데 아마존의 매출 성장률은 Woolworths보다 23.8%포인트 높았다. 즉 두 기업의 격차가 점차 좁혀지고 있다는 뜻이다. 저자들은 이 두 가지 관점을 각각 절대적 성과와 상대적 성과로 구분한다. 절대적 성과는 기업이 도달한 절대적인 수준을 뜻하고, 상대적 성과는 경쟁사와의 격차를 뜻한다.
✔️ 연구 내용 및 논리
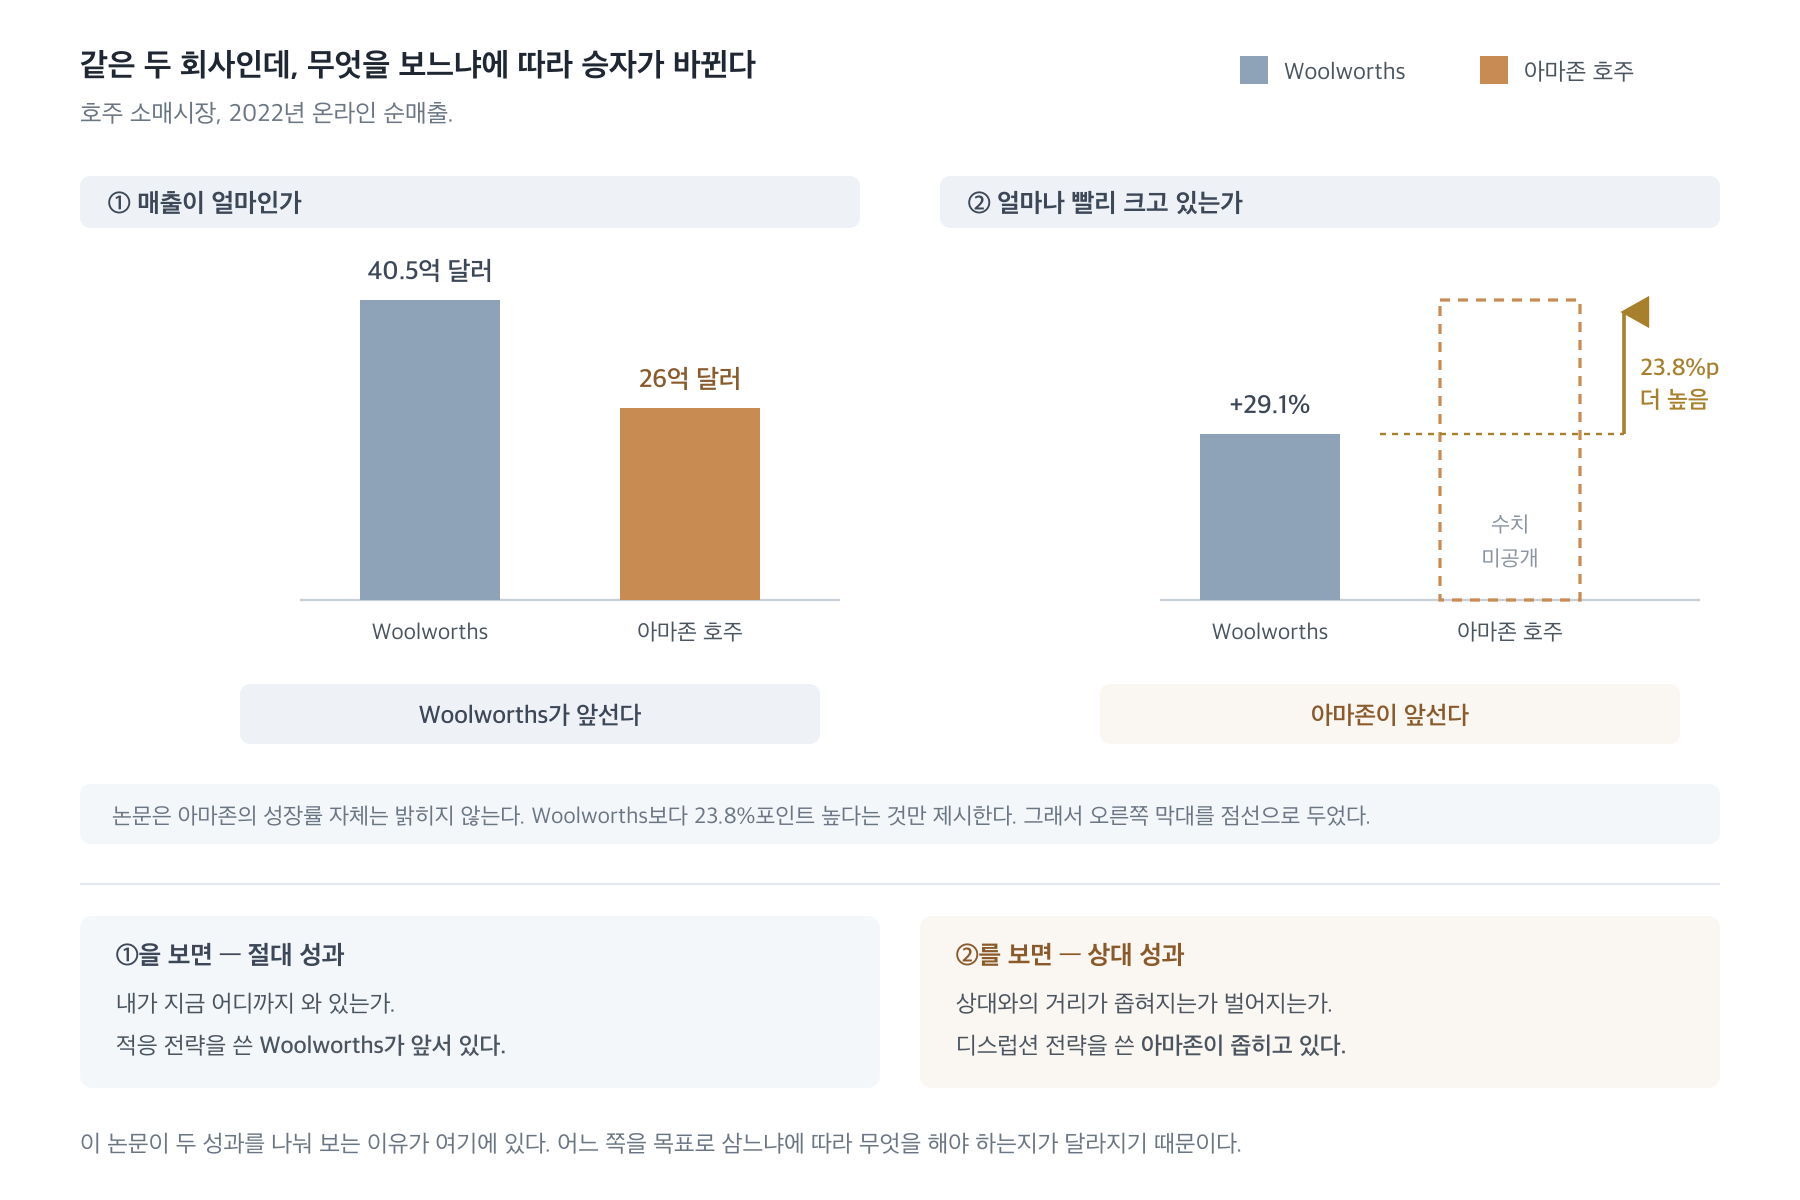
그림 1. 누가 이기고 있나. 호주 소매시장 2022년 온라인 순매출. 규모로 보면 Woolworths가, 성장률로 보면 아마존이 앞선다.
그렇다면 어느 전략이 더 나은가. 이는 실제 기업 사례만으로는 확인하기 어려운 질문이다. Woolworths가 만약 아마존처럼 가치사슬을 재편했다면 어떤 결과가 나왔을지는 어디에서도 확인할 수 없기 때문이다. 기업은 단 한 번의 역사만을 살아간다. 그래서 저자들은 시뮬레이션이라는 방법을 택한다. 여기서 이 논문의 발상이 흥미롭다. 생물학에서 진화를 설명하기 위해 만든 모형을 기업 간 경쟁에 적용한 것이다. 봉우리와 골짜기로 이루어진 지형을 상정하고, 기업을 그 지형 위에서 더 높은 지점을 찾아 움직이는 존재로 놓는다. 이 틀에서 적응은 현재 지형에서 조금씩 더 높은 곳으로 옮겨가는 과정이고, 디지털 디스럽션은 지형 자체를 새로 그리는 과정이다.
결과를 간단히 요약하면, 디지털 디스럽션은 경쟁사보다 앞서는 데는 도움이 되지만 정작 자기 자신의 성과는 오히려 깎아먹을 수 있다. 그리고 같은 상황에서도 무엇을 목표로 삼느냐에 따라 최선의 선택이 정반대로 뒤바뀌는 구간이 존재한다.
디지털 디스럽션은 요즘 경영 담론에서 거의 정답처럼 이야기된다. 넷플릭스뿐 아니라 음악과 출판 산업에서도 비슷한 일이 벌어졌고, 이런 사례들이 워낙 널리 알려져 있기 때문이다. 그런데 저자들이 지적하는 것은, 우리가 알고 있는 사례들이 대부분 성공한 사례라는 점이다. 디지털로 가치사슬을 재편하려다 실패한 시도도 많지만, 그런 사례는 잘 알려지지 않는다. 성공한 사례만 모아 놓고 보면 디지털 디스럽션이 항상 옳은 선택처럼 보이기 마련이다. 정작 알아야 할 것은 디지털 디스럽션이 언제 통하고 언제 그렇지 않은가인데, 성공 사례만으로는 이를 가려낼 수 없다.
저자들은 기존 연구에도 다루지 않은 부분이 있다고 본다. 지금까지의 연구는 대체로 기업 하나만을 놓고 판단해 왔다는 것이다. 가치사슬을 새로 구성한 기업이든 그 영향을 받은 기업이든, 한쪽에 초점을 맞춰 그 기업이 어떤 역량을 갖췄고 기술을 어떻게 활용했는지를 설명하는 데 그쳤다. 그런데 한 기업이 가치사슬을 새로 구성하면 그 기업의 성과만 달라지는 것이 아니다. 다른 기업들이 선택할 수 있는 전략의 폭도 함께 달라진다. 호주 소매시장이 아마존의 새로운 방식을 받아들이면서 고객 수요, 주문 처리, 성과 평가 기준 자체가 바뀌었고, Woolworths는 이렇게 바뀐 기준 위에서 다시 전략을 선택해야 했다. 그러니 아마존이라는 기업 하나만 보아서는 그 선택이 옳았는지 판단할 수 없다는 것이 저자들의 지적이다.
이를 실제 자료만으로 확인하기 어렵다는 점은 앞서 언급한 바와 같다. 그래서 저자들은 시뮬레이션을 통해 두 기업이 동시에 상호작용하는 구도를 구현한다. 이 논문이 묻는 질문은 두 가지다. 첫째, 디지털 디스럽션과 적응 사이에는 어떤 성과 트레이드오프가 존재하는가. 둘째, 어떤 조건에서 디지털 디스럽션을 택해야 하고 어떤 조건에서는 택하지 말아야 하는가.
✔️ 데이터 및 방법론
이 논문에는 실제 기업 데이터가 없다. 대신 컴퓨터 안에 가상의 경쟁 상황을 구현해 실행한다. 이런 방법을 시뮬레이션이라고 한다.
산업공학에서 문제를 푸는 방법은 크게 두 갈래로 나뉜다. 하나는 최적화다. 목표와 제약을 수식으로 정리하고, 그 조건에서 가장 좋은 답 하나를 계산해내는 것이다. “생산량을 이렇게 배분하면 비용이 최소”처럼 명확한 답이 도출된다. 그런데 최적화가 잘 작동하지 않는 경우가 있다. 관계가 너무 복잡하게 얽혀 있어 수식으로 정리되지 않거나, 우연이 크게 작용하거나, 상대의 반응에 따라 나의 최선이 계속 달라질 때다.
이 논문이 다루는 상황이 정확히 이에 해당한다. 결정들이 서로 얽혀 있고, 시장이 새로운 방식을 받아들일지는 확률로만 표현되며, 경쟁사가 무엇을 하느냐에 따라 최선의 답이 뒤바뀐다. 이럴 때 활용할 수 있는 것이 시뮬레이션이다. 답을 직접 계산해내는 대신, 모형을 만들어 놓고 실제로 실행해 보는 것이다. 즉, 가상의 기업에 일정한 규칙을 부여하고 정해진 기간 동안 전략을 선택하게 한 뒤 그 결과를 관찰한다. 한 번의 실행만으로는 우연에 크게 좌우되므로, 조건마다 같은 시뮬레이션을 여러 번 반복해 평균을 낸다.
결과적으로 도출되는 답의 성격도 다르다. 최적화가 “이것이 정답이다”라고 말한다면, 시뮬레이션은 “이런 조건에서는 대체로 이런 결과가 나타난다”에 가깝다. 이 논문이 제시하는 결과 역시 검증된 사실이라기보다는, 다양한 조건에서 반복적으로 확인된 경향에 가깝다.
NK 모델 — 무엇이며 왜 이 틀을 차용했나
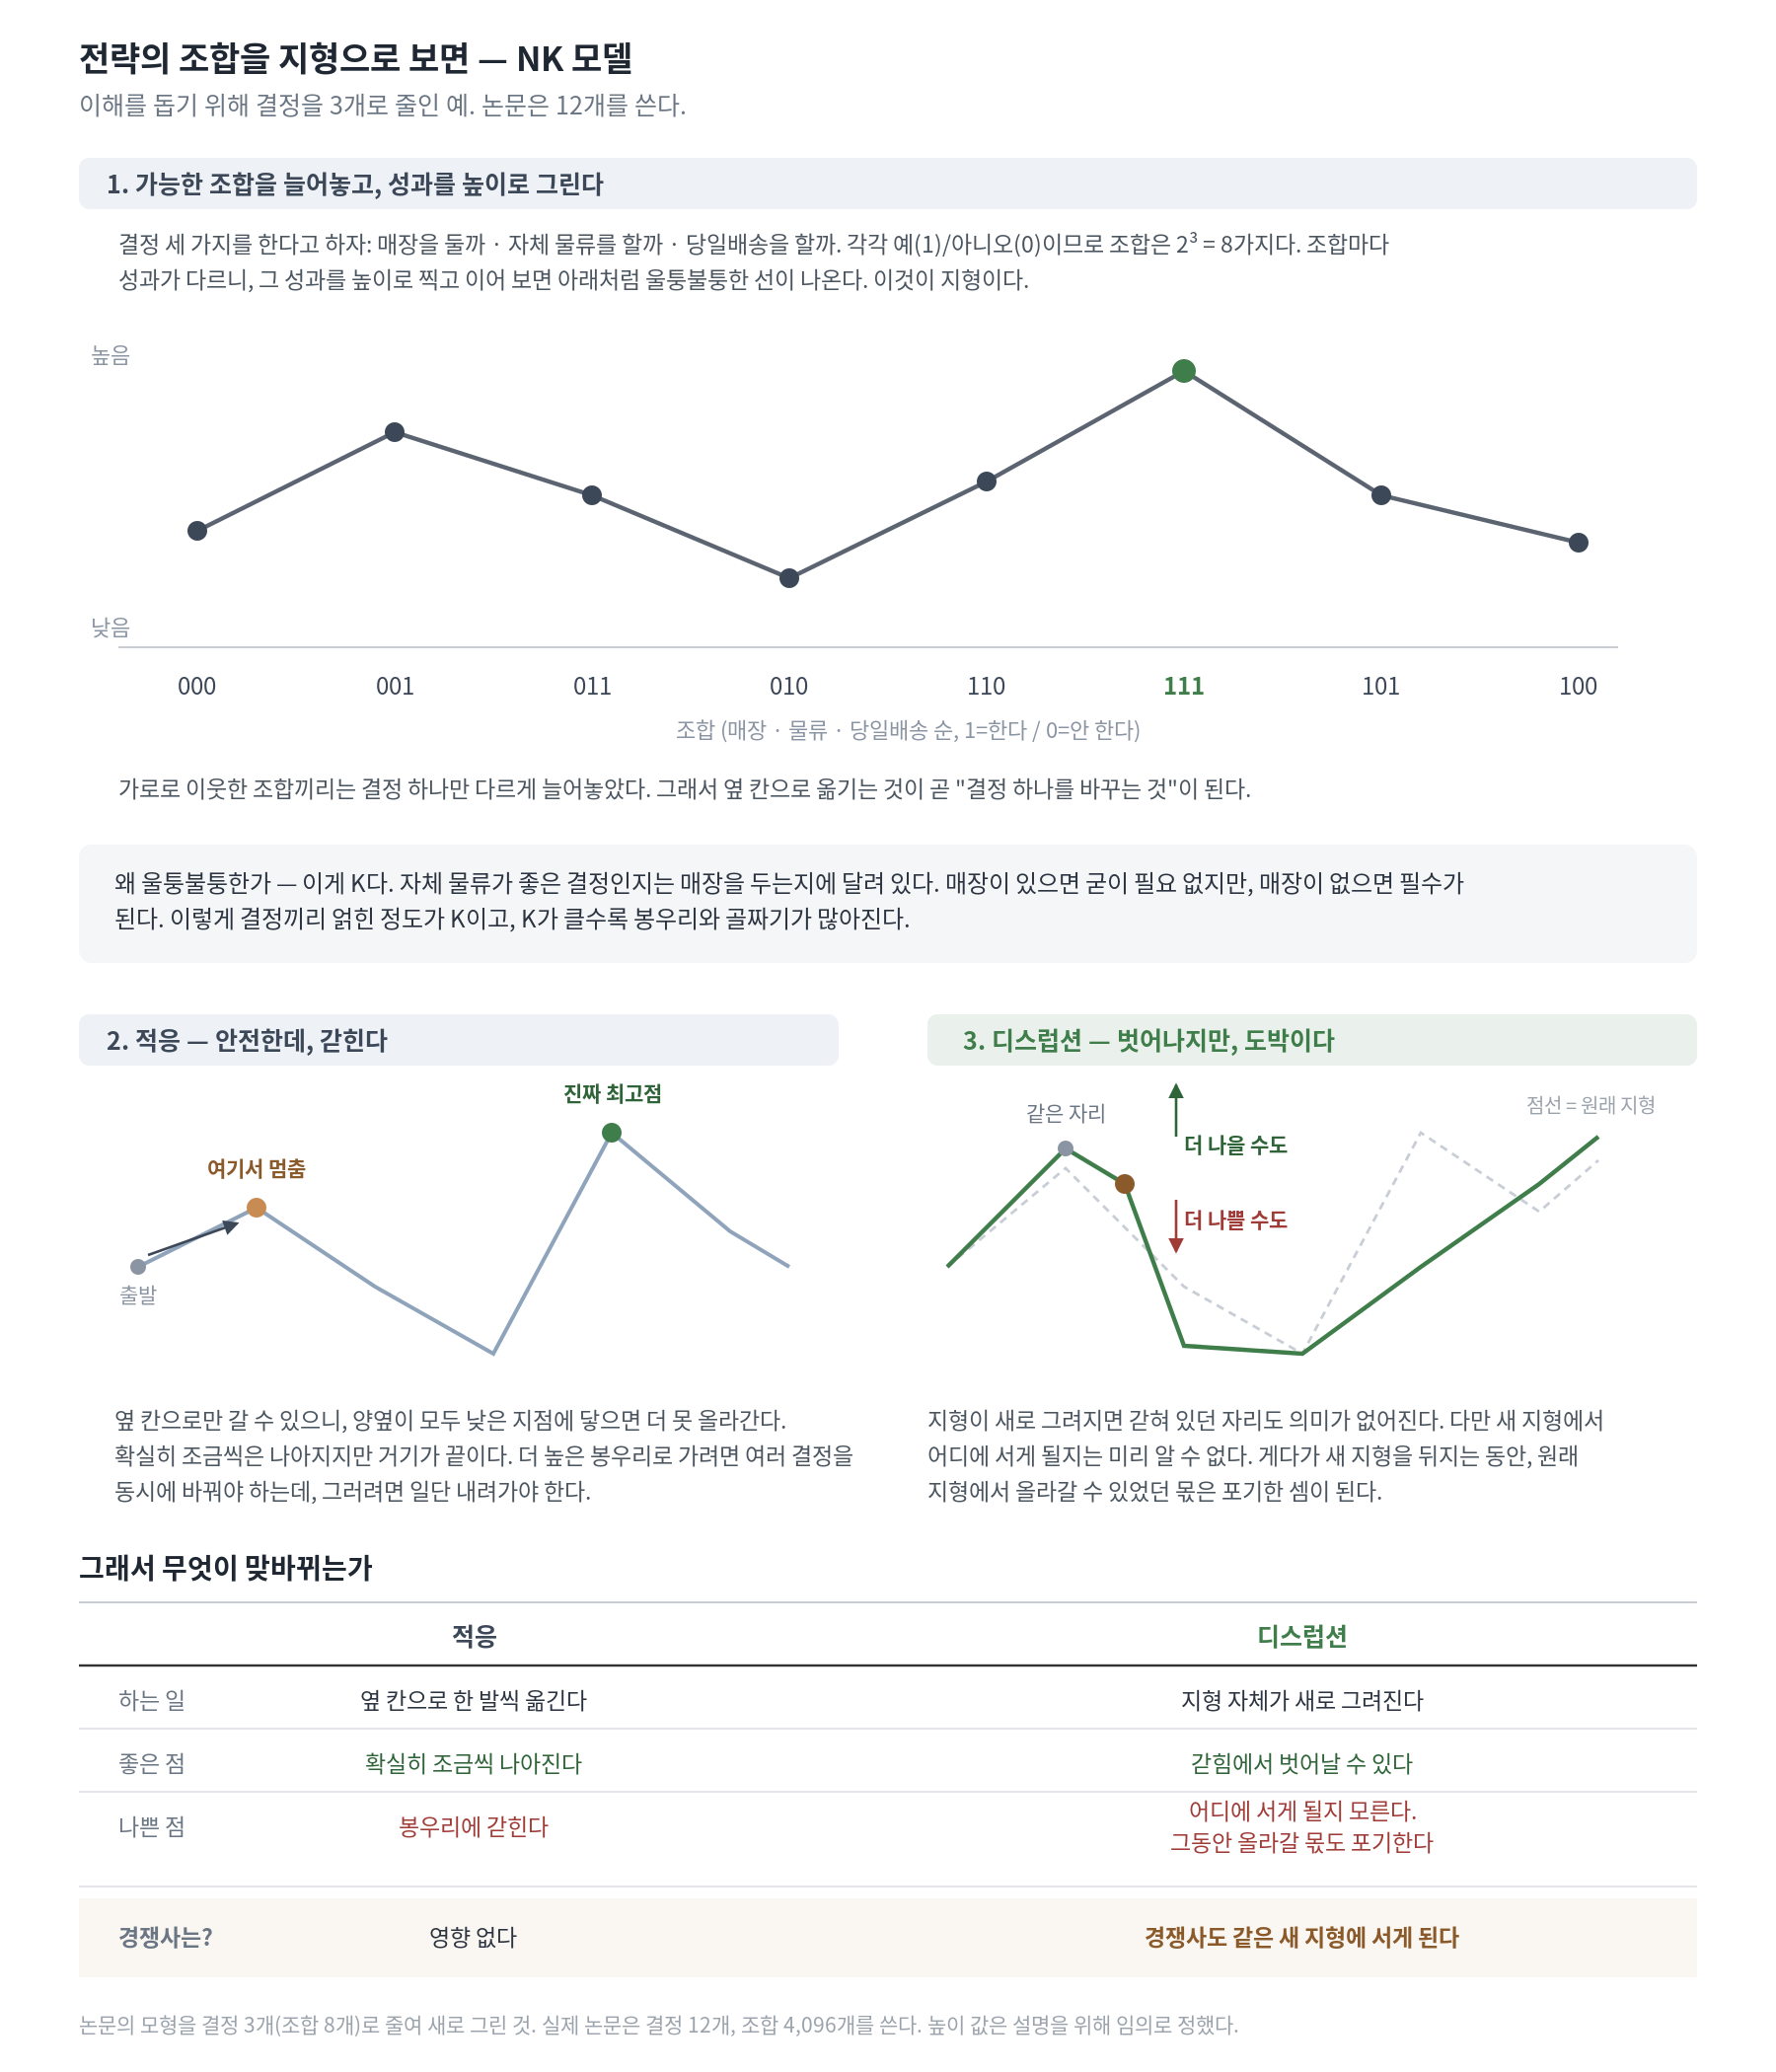
그림 2. 회사의 결정을 3개로 줄여 전략의 조합을 지형으로 보인 예.
적응은 옆 칸으로 한 발씩 옮기는 것이고, 디지털 디스럽션은 지형 자체가 새로 그려지는 것이다.
저자들이 사용한 시뮬레이션 틀은 NK 모델이다. 1993년 생물학자 스튜어트 카우프만이 고안한 모형으로, 원래는 생물의 진화를 설명하기 위한 것이었다. 카우프만의 질문은 다음과 같았다. 생물의 형질은 여러 유전자가 함께 만들어내는데, 유전자들이 서로 영향을 주고받는다면 좋은 조합을 찾는 일이 왜 그토록 어려운가. 이를 설명하기 위해 그는 적응도 지형(fitness landscape)이라는 개념을 도입했다. 가능한 조합 하나하나를 지도 위의 한 점으로 놓고, 그 조합이 얼마나 우수한지를 그 점의 높이로 표현하는 방식이다. 그러면 봉우리와 골짜기로 이루어진 지형이 만들어지고, 생물은 그 위에서 조금씩 이동하며 더 높은 지점을 찾는 존재가 된다.
모델의 이름은 이 지형의 모양을 결정하는 두 숫자에서 유래했다. N은 결정 요소의 개수를, K는 그 요소들이 서로 얼마나 얽혀 있는지를 뜻한다. 이 틀이 기업 전략에도 적용되는 이유는 기업의 전략적 의사결정 역시 같은 구조를 갖기 때문이다. 기업도 여러 결정을 동시에 내리고, 그 결정들이 서로 영향을 주고받으며, 이를 조금씩 조정해 가며 더 나은 조합을 찾는다. 그래서 NK 모델은 경영전략 연구에서 오랫동안 활용되어 왔다.
다만 이 논문은 한 지점에서 기존 연구와 차별화된다. 지금까지의 연구에서 지형은 고정된 것이었다. 기업이 그 위를 이동할 뿐 지형 자체는 변하지 않았다. 이 연구는 기업의 행동이 지형 자체를 바꿀 수 있다고 전제하고, 이를 시뮬레이션으로 구현한다. 디지털 디스럽션이 바로 그것이다. 앞서 “좋은 성과의 기준 자체가 바뀐다”고 표현했던 것을, 이 모형에서는 “지형이 새로 그려진다”로 옮긴 셈이다.
모형을 하나씩 살펴보자. 먼저 기업의 전략을 N개의 결정으로 나눈다. 각 결정은 0 또는 1의 값을 갖는다. 매장을 둘 것인가 말 것인가, 자체 물류를 운영할 것인가 말 것인가와 같은 선택을 나타내는 자리표시자다. 기업 하나의 상태는 이런 결정들의 벡터로 표현된다.
논문은 N을 12로 설정했다. 가능한 조합은 2¹² = 4,096가지이며, 이 4,096개가 지형 위의 각 점에 해당한다.
각 결정이 성과에 기여하는 정도는 π로 표기한다. 기업 전체의 성과는 이 기여도들의 평균이며, 이것이 곧 그 위치의 높이가 된다. 이 관계를 식으로 정리하면 다음과 같다.
풀어 말하면, 기업의 성과 Π는 N개 결정 하나하나가 만들어내는 기여도 πm을 모두 더해 평균 낸 값이다. 그런데 각 기여도 πm은 그 결정 하나(dm)만으로 정해지지 않고, 다른 결정들(d−m)에도 함께 좌우된다. 즉 기업의 성과는 개별 결정의 단순한 합이 아니라, 결정들이 서로 얽혀 만들어내는 값이라는 뜻이다.
여기서 주목할 부분은 π의 괄호 안에 있는 d−m이다. m번째 결정의 기여도는 그 결정 자체의 값(dm)뿐 아니라 다른 결정들(d−m)에도 좌우된다. 예컨대 자체 물류를 갖추는 것이 좋은 선택인지는 매장을 두는지 여부에 따라 달라질 수 있다는 뜻이다. 이때 몇 개의 다른 결정에 좌우되는지를 나타내는 값이 K이며, 논문은 K를 6으로 설정했다. K는 지형의 전체적인 모양을 결정한다. K가 0이면 결정들이 서로 독립적이어서 하나씩 더 나은 쪽으로 바꾸기만 해도 최고점에 도달할 수 있다. 매끈한 언덕 하나로 이루어진 지형인 셈이다. 반대로 K가 크면 하나의 결정을 바꿀 때 다른 결정들의 기여도까지 함께 흔들린다. 그 결과 봉우리와 골짜기가 복잡하게 뒤섞인 지형이 만들어지고, 눈앞의 봉우리에 올라섰다고 해서 그것이 전체에서 가장 높은 지점이라는 보장은 없다.
이 지형 위에서 두 전략이 갈린다. 적응은 현재 지형에서 결정을 하나씩 바꿔가며 더 높은 지점을 찾는 과정이다. 반면 디지털 디스럽션은 성과 함수 자체를 Π에서 Π′로 바꾸는 과정이다. 새로 만들어지는 성과 함수도 형태는 동일하다. Π(d) = (1/N)Σπm(dm, d−m)이지만, 그 안의 기여도 π′m 값이 모두 새로 정해진다는 점이 다르다. 그 결과 봉우리와 골짜기의 위치 자체가 전부 달라진다.
전략은 비율로 표현된다. 기업이 보유 자원 중 얼마를 디지털 디스럽션에 투입할지를 α로 나타낸다. α가 0이면 순수한 적응 전략, 1이면 순수한 디지털 디스럽션 전략이다. 이 논문은 둘 중 하나를 택하는 이분법이 아니라, 자원을 어떻게 배분할지의 문제로 다룬다는 점이 특징이다.
새로운 지형이 실제로 자리 잡을지는 시장이 결정한다. 가치사슬을 재편했다고 해서 시장이 곧바로 이를 수용하는 것은 아니다. 시장이 이를 받아들일 확률을 ρ로 두고, 논문은 낮은 경우(0.1)와 높은 경우(0.9)로 나누어 분석한다. 이 값은 규제나 산업의 디지털 준비도 같은 여러 요인을 포괄적으로 담아낸 것이다.
이 모형에서는 두 기업을 동시에 놓고 분석한다. 상대 기업의 전략에 따라 자사의 최선의 선택이 달라지기 때문이다. 다만 분석의 대상은 여전히 개별 기업의 성과다. 두 기업의 성과를 합산하거나 산업 전체의 이익을 측정하는 것은 아니다.
성과는 두 가지 방식으로 측정한다. 절대적 성과는 마지막 시점에 자사가 도달한 높이이고, 상대적 성과는 자사와 경쟁사의 높이 차이다. 이를 식으로 쓰면 다음과 같다.
절대적 성과는 마지막 시점 T에서 자사가 도달한 높이, 곧 Πi(diT) 그 자체다. 상대적 성과 ΔΠi는 여기서 경쟁사의 높이 Πj(djT)를 뺀 값이다. 상대적 성과가 0보다 크면 자사가 앞선 것이고, 0보다 작으면 뒤진 것이다.
두 기업은 50기간 동안 동시에 전략을 실행하며, 각 조건마다 시뮬레이션을 1만 번씩 반복해 평균을 낸다. 지금까지 등장한 변수를 한자리에 정리하면 다음과 같다.
| 기호 | 뜻 | 값 |
|---|---|---|
| N | 회사가 내리는 전략적 결정의 개수 | 12 |
| K | 각 결정이 다른 몇 개 결정에 얽혀 있는가 (지형의 울퉁불퉁함) | 6 |
| d | 회사의 현재 위치 (결정들의 조합) | 0/1 벡터 |
| π | 결정 하나가 성과에 기여하는 정도 | 무작위로 부여 |
| Π | 회사의 성과 = π들의 평균 = 지형에서의 높이 | 계산값 |
| Π′ | 디지털 디스럽션으로 새로 그려진 지형에서의 성과 | 계산값 |
| α | 자원 중 디지털 디스럽션에 거는 비율 | 0–1 |
| ρ | 시장이 새 지형을 받아들일 확률 | 0.1 또는 0.9 |
| T | 시뮬레이션 기간 | 50 |
✔️ 연구 결과
첫 번째 질문, 절대적 성과에서는 어떤 트레이드오프가 있는가.
시장이 새로운 방식을 잘 받아들이지 않고(ρ = 0.1) 경쟁사도 적응 전략에 머무를 때, 자사의 성과를 최대화하려면 디지털 디스럽션에 소규모로만 자원을 투입해야 한다(α ≈ 0.2). 이 구간에서 성과 곡선은 뒤집힌 포물선 형태를 띠어, 소규모로 투입하면 성과가 오르지만 투입량을 늘릴수록 오히려 나빠진다. 저자들은 이 소규모 투자를 일종의 옵션으로 해석한다. 판을 바꿀 가능성을 열어 두되, 정말 유리하다고 판단될 때만 본격적으로 실행하는 전략이라는 것이다. 반면 자원을 전부 투입하는 것은 기회비용이 크다. 새로운 지형에서 더 나은 위치를 찾지 못하면 원래 위치로 되돌아가야 하는데, 그동안 기존 지형에서 얻을 수 있었던 성과를 포기한 셈이 되기 때문이다.
같은 조건에서 경쟁사가 가치사슬 재편에 나서면 상황이 달라진다. 이때는 디지털 디스럽션을 거의 접는 것(α ≈ 0)이 최선이다. 상대가 이미 시장에 흔들림을 일으키고 있는 상황에서, 자사까지 나서서 추가로 흔들 이유가 없다는 것이다.
시장이 새로운 방식을 잘 받아들이면(ρ ≈ 0.9) 저울은 디지털 디스럽션 쪽으로 기운다. 다만 이는 경쟁사가 적응 전략에 머무를 때에 한정된다. 이 경우 적응과 디지털 디스럽션을 적절히 병행하는 것이 가장 좋다(α ≈ 0.8). 새로운 지형이 자리 잡을 가능성을 높게 잡으면서도, 기존 지형에서 얻을 수 있는 이득까지 함께 챙기는 전략이다. 그런데 이 경우에도 경쟁사가 재편에 나서면 성과 곡선이 계속 하락해, 결국 적응에만 집중하는 것(α ≈ 0)이 최선이 된다.
두 번째 질문, 상대적 성과에서는 어떤 결과가 나타나는가. 여기서는 양상이 달라진다.
시장이 새로운 방식을 잘 받아들이지 않을 때는 앞서와 비슷한 결론이 나온다. 디지털 디스럽션은 적당한 수준에서만 시도하는 것이 낫다(α ≈ 0.3). 흥미로운 점은, 경쟁사가 가치사슬 재편에 나설 때 오히려 자사의 상대적 성과가 좋아진다는 것이다. 경쟁사가 성과 없는 투자를 감행하면서 기존 지형에서 얻을 수 있었던 이득까지 포기하는 동안, 둘 사이의 격차가 자사에 유리한 방향으로 벌어지기 때문이다.
반면 시장이 새로운 방식을 잘 받아들일 때는 결과가 완전히 뒤바뀐다. 성과 곡선이 계속 상승해, 자원을 전부 투입하는 것이 최선이 된다. 경쟁사가 똑같이 재편에 나설 때조차 마찬가지다. 가치사슬 재편에 성공하면 자사의 성과가 오르거나 경쟁사의 성과가 내려가거나 둘 중 하나는 반드시 일어나는데, 상대적 성과는 바로 이 격차만을 보기 때문이다.
이처럼 같은 상황에서도 목표에 따라 최선의 선택이 정반대로 갈리는 구간이 존재한다. 시장이 열려 있고 경쟁사가 재편에 나설 때, 자사의 절대적 성과를 지키려면 적응에만 집중해야 하고(α = 0), 경쟁사를 상대적으로 앞서려면 자원을 전부 투입해야 한다(α = 1). 무엇을 성과 목표로 삼느냐가 정반대의 처방으로 이어지는 것이다.
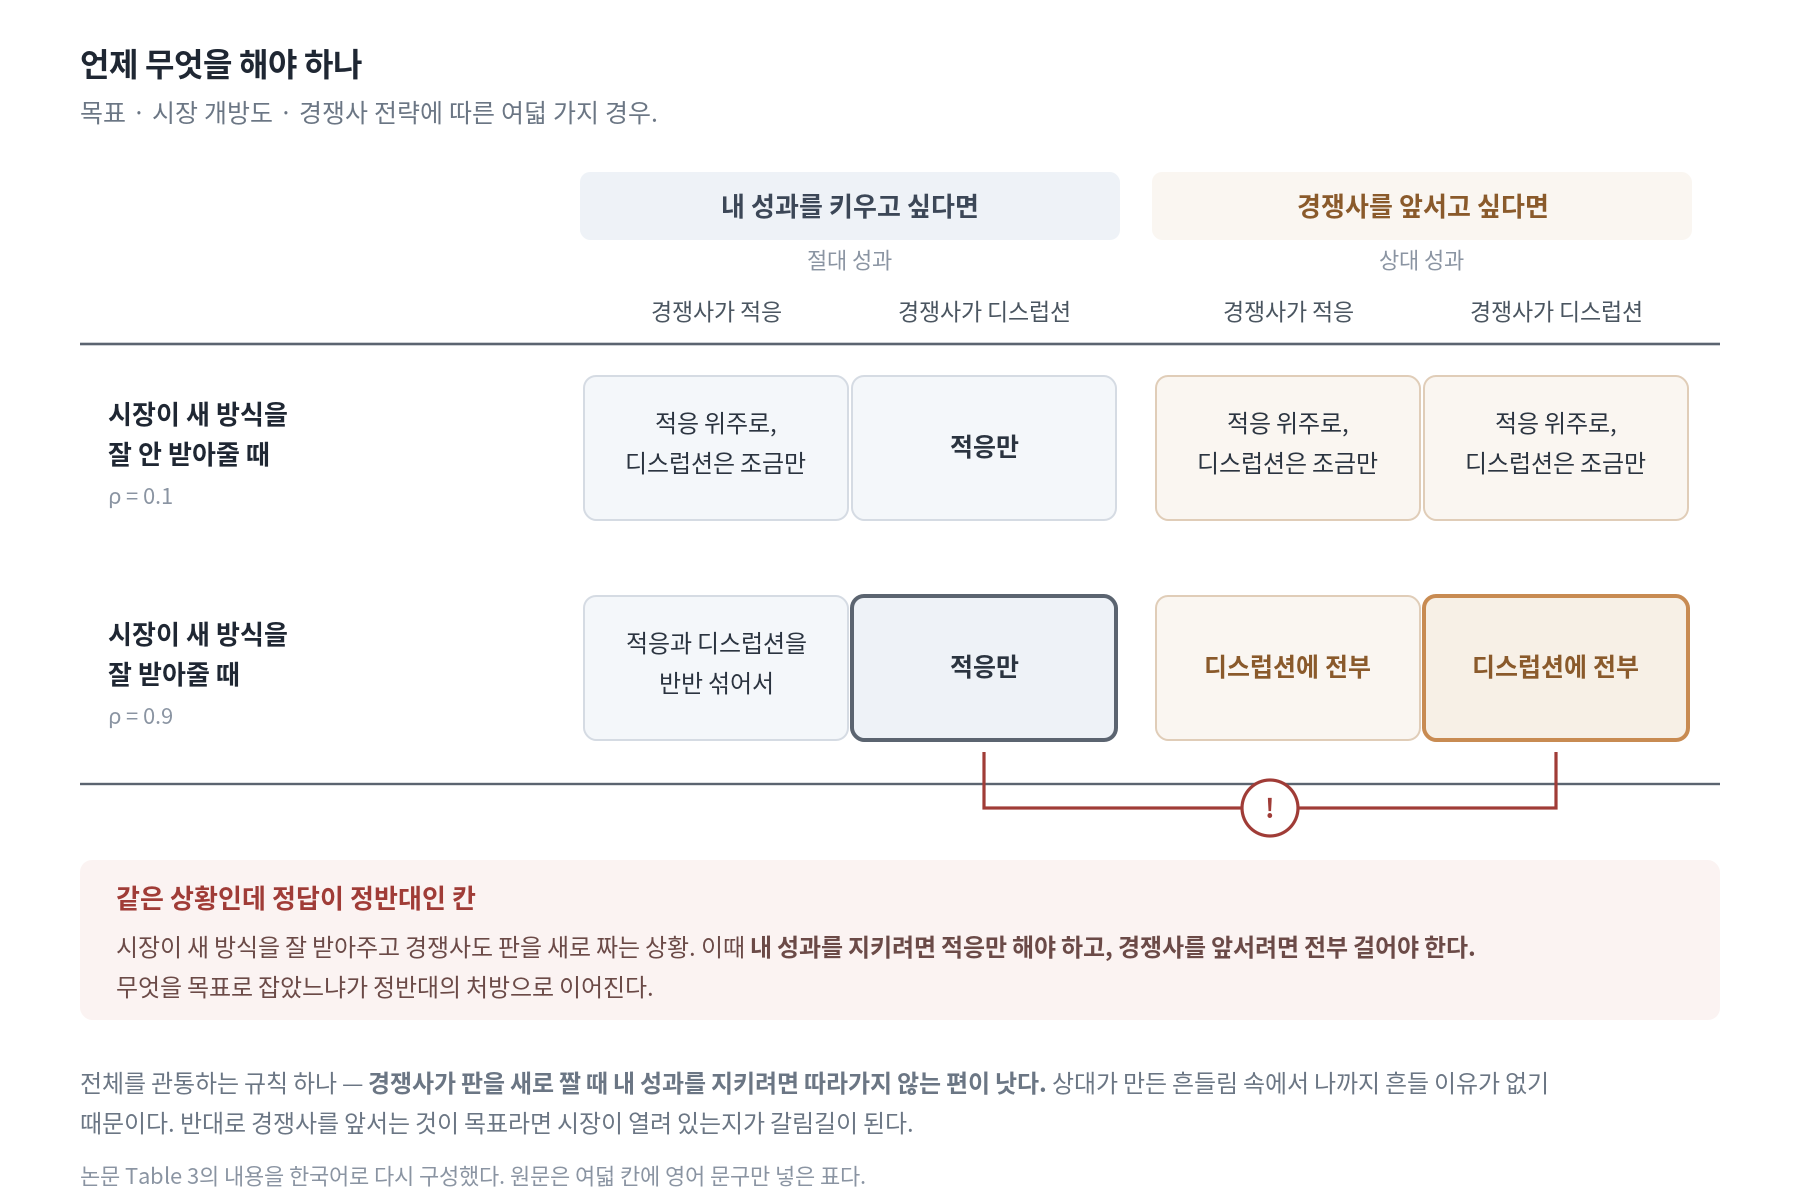
그림 3. 상황별 최적 전략. 성과 목표·시장 개방도·경쟁사 전략에 따라 나뉘는 여덟 가지 경우를 정리했다. 최선의 전략이 서로 뒤바뀌는 칸을 강조했다. (색 규칙: 회색·파랑 계열 = Woolworths / 적응 / 절대적 성과, 주황 계열 = 아마존 / 디지털 디스럽션 / 상대적 성과, 붉은색 = 최적 전략이 뒤바뀌는 지점)
저자들은 이 결과가 우연이 아닌지 폭넓게 검증했다. 전략 요소 수(N)를 10~16으로, 지형의 복잡도(K)를 4~8로, 관찰 기간을 10~1,000으로 바꿔가며 재확인했다. 새로운 지형이 기존 지형과 절반가량 겹치도록 설정해 보기도 했고, 시장이 새 지형을 받아들이는 방식을 성과에 비례하도록 바꿔 보기도 했다. 결론은 그대로 유지되었다. 다만 이는 어디까지나 모형 내부에서의 검증이라는 점을 짚어 둘 필요가 있다. 설정을 바꿔도 같은 결론이 나온다는 뜻일 뿐, 현실에서도 그렇다는 것을 증명하는 것은 아니다.
✔️ 결론
이 논문은 디지털로 가치사슬을 재편하는 전략이 무엇을 성과 목표로 삼느냐에 따라 정반대의 처방이 될 수 있음을 보였다. 경쟁사보다 앞서는 데는 도움이 되지만 자사의 절대적 성과는 오히려 깎아먹을 수 있으며, 시장이 이를 받아들일 준비가 되어 있는지와 경쟁사가 어떻게 나오는지에 따라 최선의 선택이 달라진다는 것이다.
이 결과가 의미를 갖는 이유는, 지금까지 이 문제를 바라보는 시각이 대체로 기업 하나에만 맞춰져 있었기 때문이다. 가치사슬을 새로 구성한 기업이 어떤 역량을 갖췄는지, 그 영향을 받은 기업이 왜 대응에 실패했는지를 설명하는 데 그쳐왔다. 그런데 한 기업이 가치사슬을 재편하면 다른 기업들의 선택지까지 함께 달라지므로, 상대의 반응을 배제하면 논의가 절반에 그친다. 저자들은 두 기업을 같은 지형 위에 놓고 서로의 전략에 반응하도록 함으로써 이 공백을 채운다.
저자들 스스로도 한계를 분명히 밝힌다. 이 연구의 목표는 이론을 정립하는 것이지 이를 실증적으로 검증하는 것이 아니므로, 실제 자료를 통한 검증은 앞으로의 과제로 남아 있다. 또한 이 논문은 두 기업이 경쟁하는 상황을 다루고 있어, 경쟁과 협력이 혼재하는 다양한 산업으로 논의를 확장해 볼 여지도 있다.
그럼에도 이 논문의 의의는 분명하다. 저자들이 특히 강조하는 것은 성과 하락을 곧바로 실패로 해석해서는 안 된다는 점이다. 자사의 절대적 성과가 주춤하는 동안에도 경쟁사와의 격차는 벌어지고 있을 수 있고, 그 격차가 나중에 경쟁사를 밀어내면서 절대적 성과의 개선으로 이어질 수도 있기 때문이다. 결국 무엇을 목표로 삼았는지와 무엇으로 성패를 판단하는지가 서로 어긋나 있지 않은지 점검해야 한다는 것이 저자들의 메시지다. 저자들은 이 시뮬레이션을 직접 실행해 볼 수 있는 웹 도구도 함께 공개했다.
✍️ 읽고 나서
읽으면서 최적화 수업이 떠올랐다. 울퉁불퉁한 지형에서 눈앞의 봉우리에 갇히는 현상을 지역 최적해라고 배웠는데, 이 논문의 지형이 정확히 그것을 나타낸다. 수업에서는 거기서 빠져나오기 위해 때로는 일부러 성과가 나빠지는 방향으로 움직이거나 멀리 도약하는 방법을 사용했다. 그런데 이 논문의 디지털 디스럽션은 도약이 아니라 지형 자체를 새로 그리는 쪽에 가깝다. 같은 문제에 이런 접근도 있을 수 있다는 점이 흥미로웠다.
솔직히 NK 모델은 처음에는 잘 와닿지 않았다. 그런데 결정 요소를 세 개로 줄여 가능한 조합 여덟 개를 직접 그려보니 훨씬 이해가 쉬웠다. 논문에서는 열두 개의 요소를 사용해 4,096가지 조합이 나오는데, 셋으로 줄이면 모든 경우를 눈으로 직접 확인해 볼 수 있다.
한편 이런 의문도 든다. 이 모형에서 기업은 자사의 α를 스스로 정할 수 있고, 시장의 개방도 ρ는 주어진 값으로 취급된다. 그런데 현실에서 이 값을 정확히 파악하고 있는 기업이 얼마나 될까. Woolworths가 “우리는 α 0.2로 간다”고 미리 정해 놓고 움직였을 것 같지는 않다. 모형이 깔끔한 만큼, 그 값들을 현실에서 어떻게 추정할 것인지는 남은 과제로 보인다. 저자들도 실증 검증은 앞으로의 과제라고 밝혀 둔 것을 보면 같은 문제의식을 공유하고 있는 듯하다. 앞으로 내가 다루는 문제에서도 지역 최적해에 갇혔을 때 탐색 방법을 바꿀 것인지, 아니면 문제 자체의 정의를 바꿀 것인지 따져보고 싶다.
📎 참고 자료
이 글에 나온 용어나 자료를 더 보고 싶은 분들을 위해.
- 이번 이슈에서 다룬 논문 원문 — 저자 소속 기관 저장소에 전문이 공개되어 있다. 함부르크대 저장소에 무료 전문이 있고, 위 링크는 출판사 페이지다.
- 저자들이 공개한 시뮬레이션 도구 — 이 논문의 시뮬레이션을 직접 돌려볼 수 있다. 조건을 바꿔가며 결과가 어떻게 달라지는지 볼 수 있어서 본문의 결론이 어디서 나온 것인지 감을 잡기 좋다.
- NK 모델 — 이 논문이 쓴 시뮬레이션 틀. 원래 진화생물학에서 유전자들의 상호작용을 설명하려고 만들어졌고, 경영전략 연구에 응용되어왔다. N은 결정 요소의 개수, K는 그 요소들이 서로 얼마나 얽혀 있는지를 뜻한다. Kauffman, S. A. The Origins of Order: Self-Organization and Selection in Evolution. Oxford University Press, 1993. NK model (영문 위키백과)
- 가치사슬 — 원재료를 들여와 만들고 팔고 사후 서비스까지 하는, 회사가 가치를 만들어내는 활동들의 사슬. 이 논문에서 적응은 이 사슬에 디지털을 얹는 것이고, 디지털 디스럽션은 사슬 자체를 다시 짜는 것이다. 가치사슬 (위키백과)
- 지역 최적해 — 주변보다는 높지만 전체에서 가장 높지는 않은 지점. 소감에서 언급한 개념으로, 이 논문의 울퉁불퉁한 지형에서 봉우리에 갇히는 상황이 여기에 해당한다.