After ChatGPT, Which Managerial Skills Did Firms Stop Asking for First? ChatGPT 이후 기업은 어떤 관리 능력부터 덜 찾게 되었나
Devigili et al. (2026) · Management ScienceDevigili et al. (2026) · Management Science
Devigili, M., Yilmaz, E. D., Gaba, V., & Greve, H. (2026). Skill Deprioritization: Reorganizing in the Age of Generative Artificial Intelligence. Management Science, 0(0).
✔️ Introduction and Summary
This issue covers a paper that empirically examines which managerial skills firms stopped looking for once generative AI arrived.
“AI will take our jobs” is a familiar line by now, but it doesn’t answer the question of exactly which skills a company cuts first when it hires less, or why those particular ones. The authors call this phenomenon skill deprioritization — a systematic reduction in firms’ demand for human skills that GenAI can effectively substitute for. Unlike existing research, which has mostly focused on augmentation (does AI make a person better at their job) or reskilling (what new skills does a person need), this paper asks a different question: what does the organization no longer need?
What matters about this definition is that what the paper measures is job postings — not headcount, and not layoffs. Take an example: recruiter postings used to routinely list “familiar with maps” as a requirement for sales or delivery roles, but once navigation apps became standard, that line quietly disappeared from postings. It’s not that companies let go of the people who once knew this skill — it’s that they stopped requiring it when hiring anew. That’s the kind of change this paper is about.
The authors combine organization theory’s classification of managerial work with queuing theory from industrial engineering to predict which skills will shrink first, then treat ChatGPT’s release as a natural experiment and use difference-in-differences to test that prediction against 11.15 million U.S. publicly listed firms’ job postings.
The headline finding: after ChatGPT, firms in industries with high GenAI exposure cut job postings requiring skills that break down and sequence work by 23%, relative to firms in low-exposure industries. Postings requiring skills that convey information (roughly 18–21%), observe and evaluate performance (roughly 23%), and handle operational problems (roughly 19%) also declined. Postings requiring the skill to hire and place people, to design reward systems, or to resolve conflict, on the other hand, showed no statistically significant change.
✔️ Research Content and Logic
Where existing research stood
Existing research on AI and work has largely operated at the level of the task — can AI substitute for a given task, how quickly and accurately can a person do it with AI’s help. The authors argue a different lens is needed. A general-purpose technology only pays off once the organization itself is redesigned around it. According to David (1990), simply installing electric motors in a factory didn’t raise productivity — the gains only showed up once the factory floor was redesigned. Applying that logic directly, looking only at how much faster GenAI makes an individual task tells you nothing about change at the organizational level. The lens the authors chose for observing that change is the firm’s hiring demand.
How to break down what a manager does
This paper classifies work not by its content, but by Puranam’s (2018) problems of organizing framework — what needs solving when multiple people work together. It splits broadly into division of labor and integration of effort, which further break into five branches and ten sub-items.
| Category | Sub-item | What it means |
|---|---|---|
| Task division | — | Breaking a goal into executable pieces and sequencing and prioritizing them |
| Task allocation | Staffing / Mapping | Deciding who gets which piece |
| Information provision | Coordination / Synchronous communication / Asynchronous communication | Making the information people need flow |
| Reward distribution | Monitoring / Incentives | Motivating people to act in line with goals |
| Exception management | Conflict resolution / Operational exception management | Handling things that didn’t go as expected |
The authors give this level of granularity for two reasons: it enables more concrete predictions — something like “GenAI will affect operational exceptions but not conflict resolution” becomes possible — and, on the measurement side, it lets each category be defined without overlapping the others.
Predicting with queuing theory
Now the moment to predict which of these ten items shrinks first. The tool the authors borrow for this is queuing theory — an industrial-engineering tool for problems of waiting in line, where knowing how fast customers arrive, how long one staff member takes to process each one, and how irregular that processing time is lets you calculate the expected wait time. Glynn et al. (2020) applied this to organizations, treating a firm’s problems (decisions requiring judgment) as customers and the people who process them as the staff behind the counter.
The simplest prediction is that one person processing problems faster means the same work gets done with fewer people. But the authors say this effect applies roughly equally across all ten categories, so it can’t tell us which category is relatively more vulnerable. So they offer three more concrete predictions.
1 Prediction: task division and operational exception management shrink together
Someone using AI can handle a wider range of problems alone, so the need to split work up and hand pieces off — and to watch over that handoff — both decline together. The authors’ example is the project management software Jira’s built-in generative AI feature, which automatically turns a plain-language goal into subtasks and dependencies.
2 Prediction: information provision shrinks
Until now, an organization’s typical model has been to compile information and push it to whoever needs it. With GenAI available, whoever needs information can pull it themselves in the moment instead. The U.S. State Department is cited as an example — it reportedly deployed an internal GenAI chatbot in 2024 and used it for summarizing policy documents and translation.
3 Prediction: monitoring shrinks
The technology for recording performance itself had already existed for a long time, but turning that data into judgment still required a person. GenAI fills exactly that gap. The example given is the HR analytics tool Culture Amp, which ran an experiment using ChatGPT to automatically compile Slack kudos, customer comments, and peer feedback into a performance summary.
By contrast, the case is weak for task allocation (staffing and mapping), incentive design, and conflict resolution — even once a person is using AI, the nature of selecting the right person and motivating them doesn’t itself change. A second-order effect could still shrink these, but only if the organization’s structure itself gets redesigned, and that takes time to experiment with, learn from, and implement — too long to expect it to show up in this paper’s observation window right after ChatGPT’s launch.
Why this counts as “reorganizing” — the span-of-control story
The “Reorganizing” in the paper’s title points to why a decline in demand for a few skills connects to the firm redesigning itself. The concept that bridges this gap is span of control — the number of subordinates a manager directly supervises. Span of control is set by (i) how often a decision requiring the manager’s approval comes up, and (ii) how variable the time to process one decision is — and it’s (ii) that this paper focuses on. Queuing theory says expected wait time falls not only when processing gets shorter, but simply when processing time becomes more predictable. As GenAI takes over a share of coordination work, the variability in a manager’s remaining workload falls, and that slack lets one manager take on more subordinates.
✔️ Data and Methodology
What was collected, and from where
The sample is 1,820 U.S. publicly listed firms, 40,465 firm-month observations. Three data sources were combined. Lightcast, a database that collects U.S. job postings daily and tags each posting with the skills it requires, supplies all of this paper’s dependent variables. Compustat provides quarterly financial data, and Revelio provides monthly headcount data by firm; both were used as control variables.
The observation window is ±12 months around ChatGPT’s public release on November 30, 2022 (pre-period: December 2021–November 2022; post-period: December 2022–November 2023). The pre-period needs to be long enough to establish a comparison baseline but recent enough to be unaffected by earlier AI developments; the post-period needs to give firms enough time to react without being so long that other events get mixed in.
How “high-exposure industries” was defined
This paper’s treated group is not “firms that actually adopted AI” — a point that’s easy to get confused about. What the authors use is AI Occupational Exposure (AIOE), a measure from Felten et al. (2021/2023). The U.S. Department of Labor’s O*NET database maps how more than 800 occupations connect to 52 abilities; multiplying this by a survey-based matrix of “how exposed is each of these 52 abilities to a given AI capability” produces an occupation-level exposure score. This paper picks out exposure to the “language modeling” AI capability specifically.
Here, k is an occupation, j is one of the 52 abilities, A is how exposed ability j is to language-modeling AI, and L and I capture how important ability j is to occupation k and how frequently it’s used. To roll this occupation-level value up to the industry level, the authors used Lightcast to tally monthly job postings by four-digit NAICS industry and occupation, found each occupation’s share within its industry and weighted accordingly, then averaged the monthly values over the pre-ChatGPT period to arrive at each industry’s exposure. Industries whose exposure exceeded the sample average were classified as treated, yielding 966 treated firms and 854 control firms — a near-even split. To put it precisely, what this paper’s criterion sorts on is not “did this firm adopt AI” but “how exposed is this firm’s occupational mix to language models.”
Sorting 33,832 skills in job postings into ten categories
Lightcast’s skill taxonomy (version 9.25) contains 33,832 individual skills, each with a roughly 70-word description. The authors went through a multi-step process to sort these into the ten categories above: a topic model (LDA) first narrowed the field to 1,765 candidate skills tied to the organizing categories; the authors read these directly and assigned labels, then checked agreement against a research assistant’s independent classification (Cohen’s kappa of 0.79). This classification standard was then taught to three GPT-4o agents and scaled up to the full 33,832 skills (93% accuracy, 89% F1), and a final human check confirmed 657 skills and 719 skill-label connections. Applying this classification produced 11,154,915 processed job postings; since one posting can span multiple categories, the counts across categories are not mutually exclusive.
The math of the queuing model
Let’s work out the span-of-control mechanism mentioned in “Research Content and Logic” above as an equation. Suppose problems arrive at a manager at an average frequency of λ, and processing time follows a distribution with mean 1/μ and variance σ². If GenAI takes over a share φ of coordination work, the remaining variance is:
For a queue of this form (M/G/1), the expected wait time is:
What’s worth noting is that σ² sits in the numerator: it isn’t only that processing time gets shorter — a fall in the variability of processing time by itself shortens the wait. As φ grows, wait time falls, and that slack lets the manager take on more subordinates. The additional headcount the authors work out is:
Here Δn is the number of additional subordinates that can be added without extending wait time, and λ̄ is the average arrival rate generated by one subordinate. The larger the original variability in processing time, and the closer the manager was already to saturation, the bigger this effect.
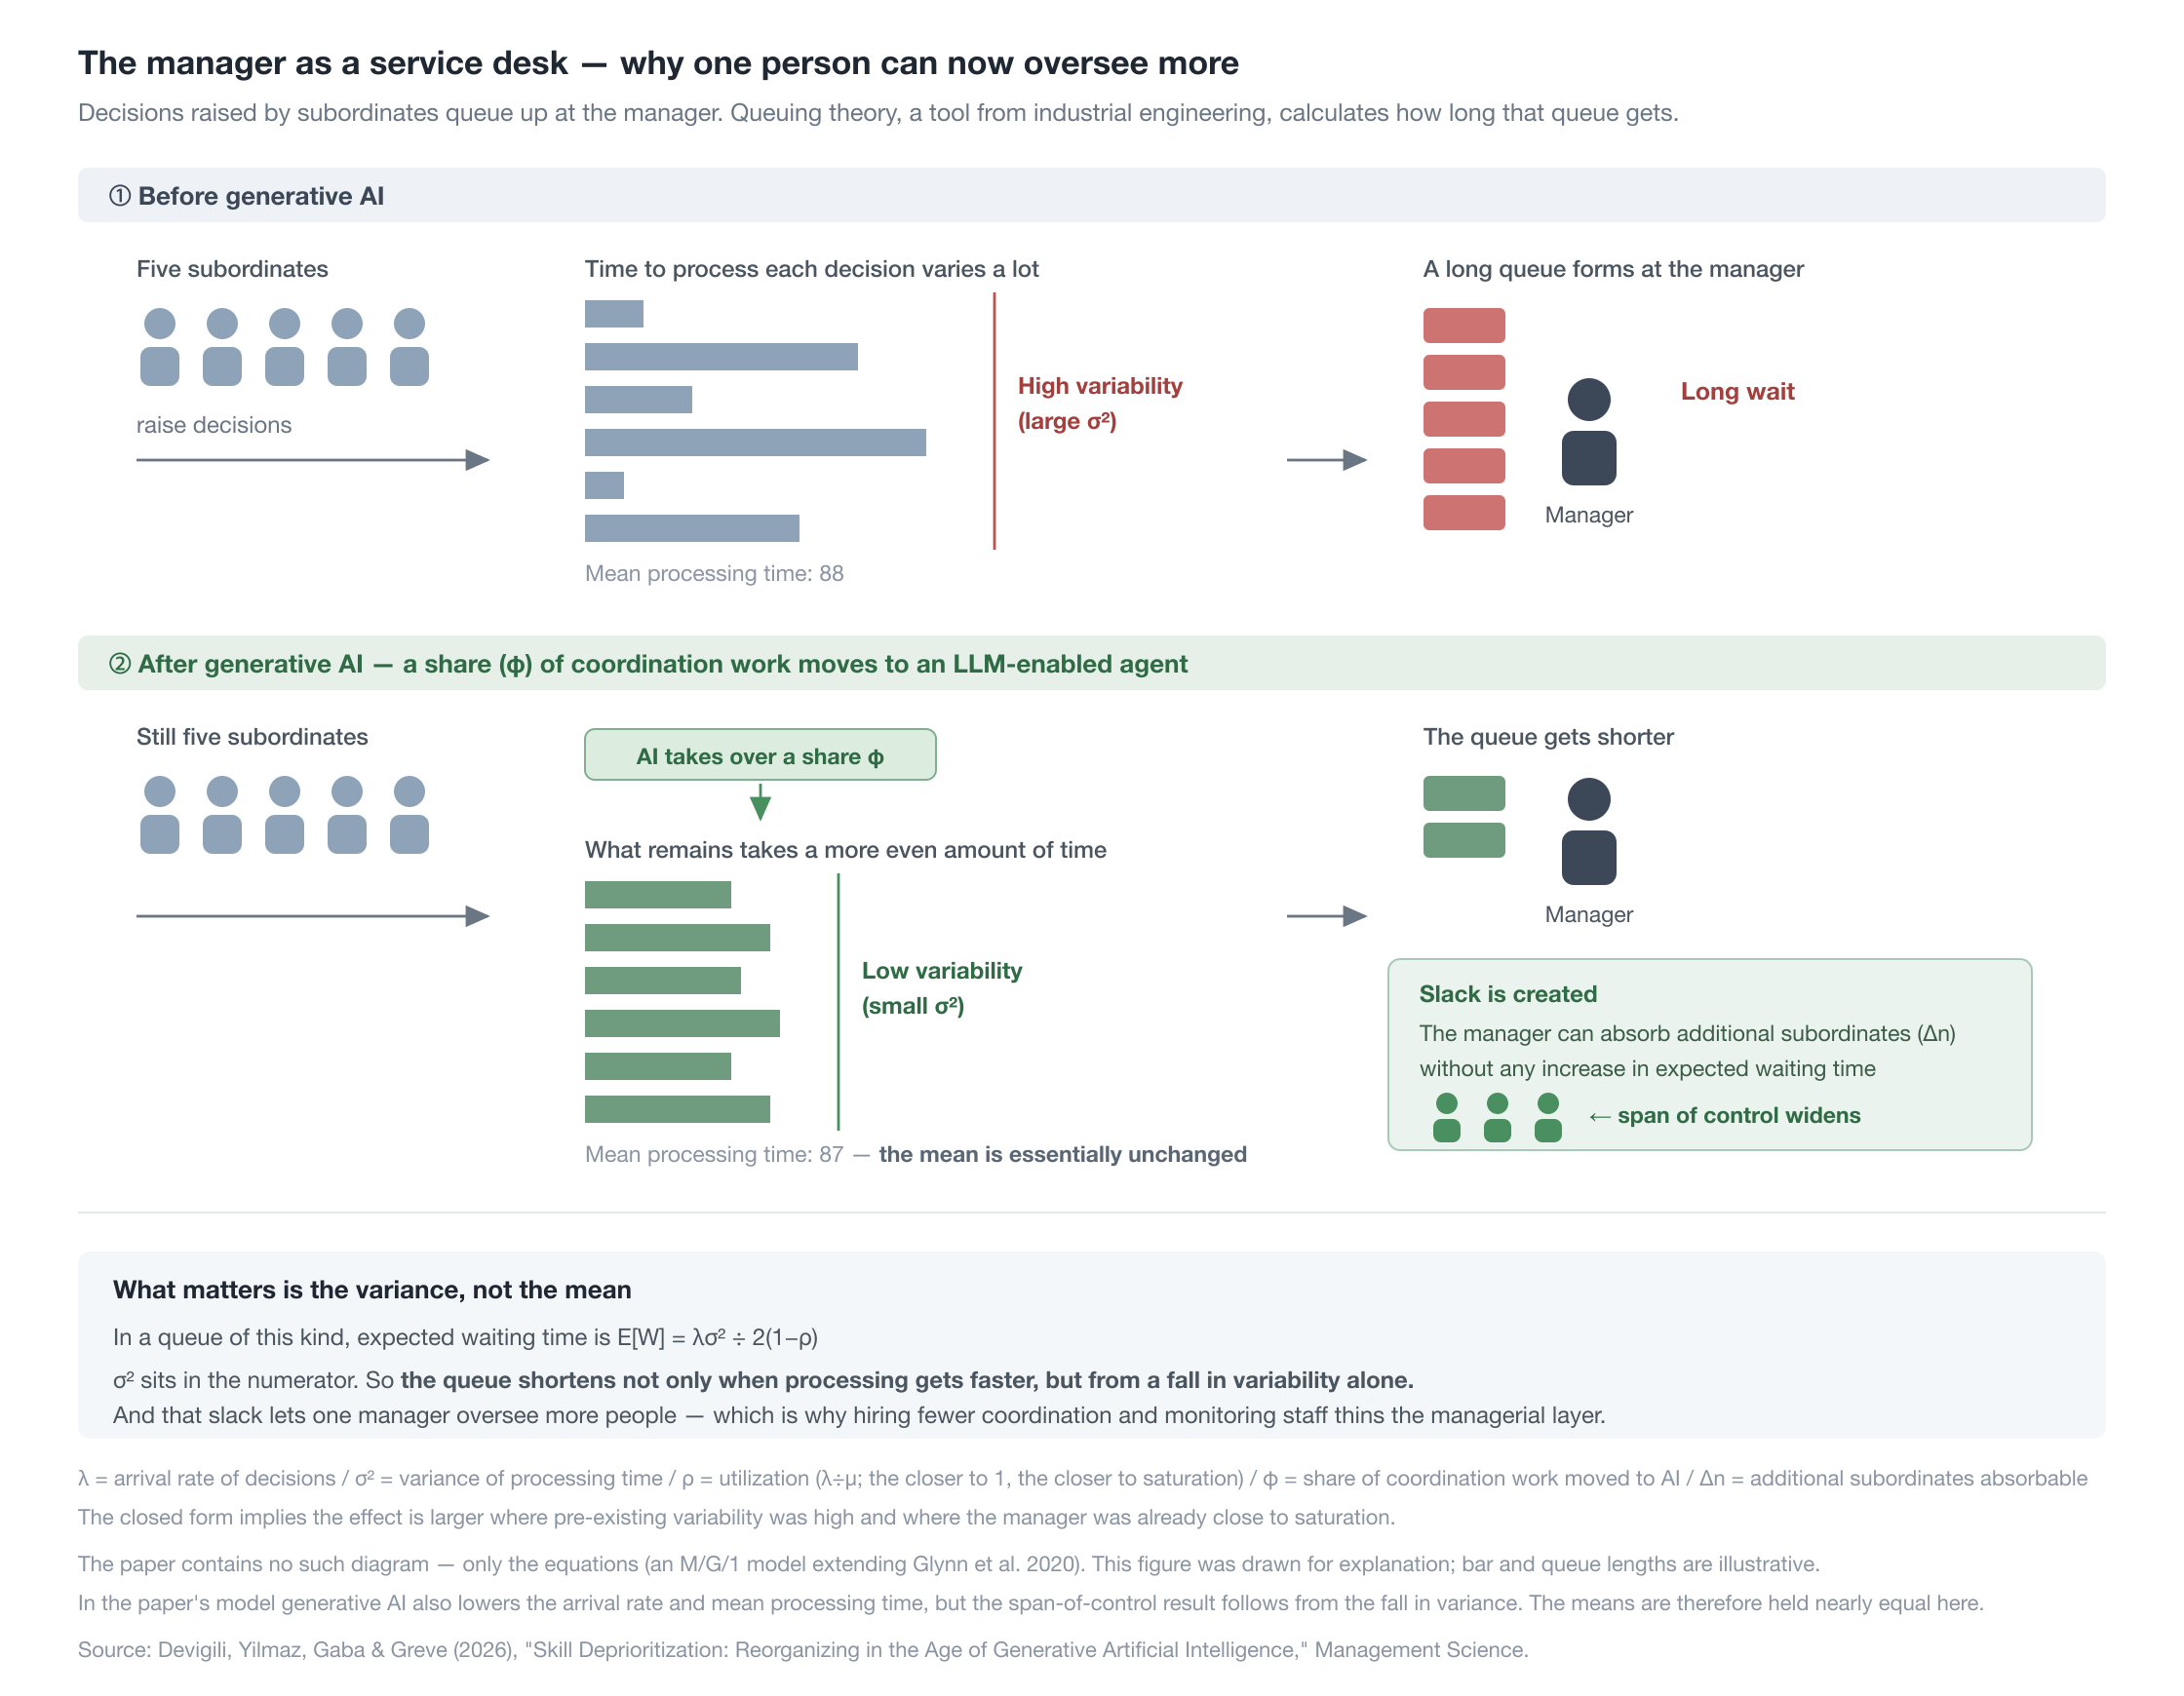
Figure 1. Viewing the manager as a service desk — decisions raised by subordinates queue up at the manager. GenAI takes over a share of the coordination work, which shrinks the variability in the time it takes to process what’s left. Even with the average unchanged, that alone shortens the queue, and the resulting slack lets one manager take on more people.
How the estimation was done
The authors used difference-in-differences (DiD): subtracting the change experienced by firms in low-exposure industries from the change experienced by firms in high-exposure industries, before versus after ChatGPT. This cancels out any factor that acted equally on all firms over the period, such as the business cycle or the overall hiring market.
Here, y is the count of firm i’s postings in month t requiring the given skill; Treated is 1 if the firm is in a high-exposure industry; PostGPT is 1 from December 2022 onward.
Estimation used Poisson Pseudo-Maximum Likelihood (PPML), because it can handle count variables with many zero values without a problematic transformation, it gives consistent estimates even when the data doesn’t strictly follow a Poisson distribution, and it holds up even when variance isn’t constant. Standard errors were clustered at the firm level.
Control variables are size (log total assets), ROA, leverage, R&D over total assets, an R&D dummy, capital expenditure over total assets, and workforce change rate — included because a firm going through large-scale layoffs might post fewer jobs overall for reasons unrelated to GenAI.
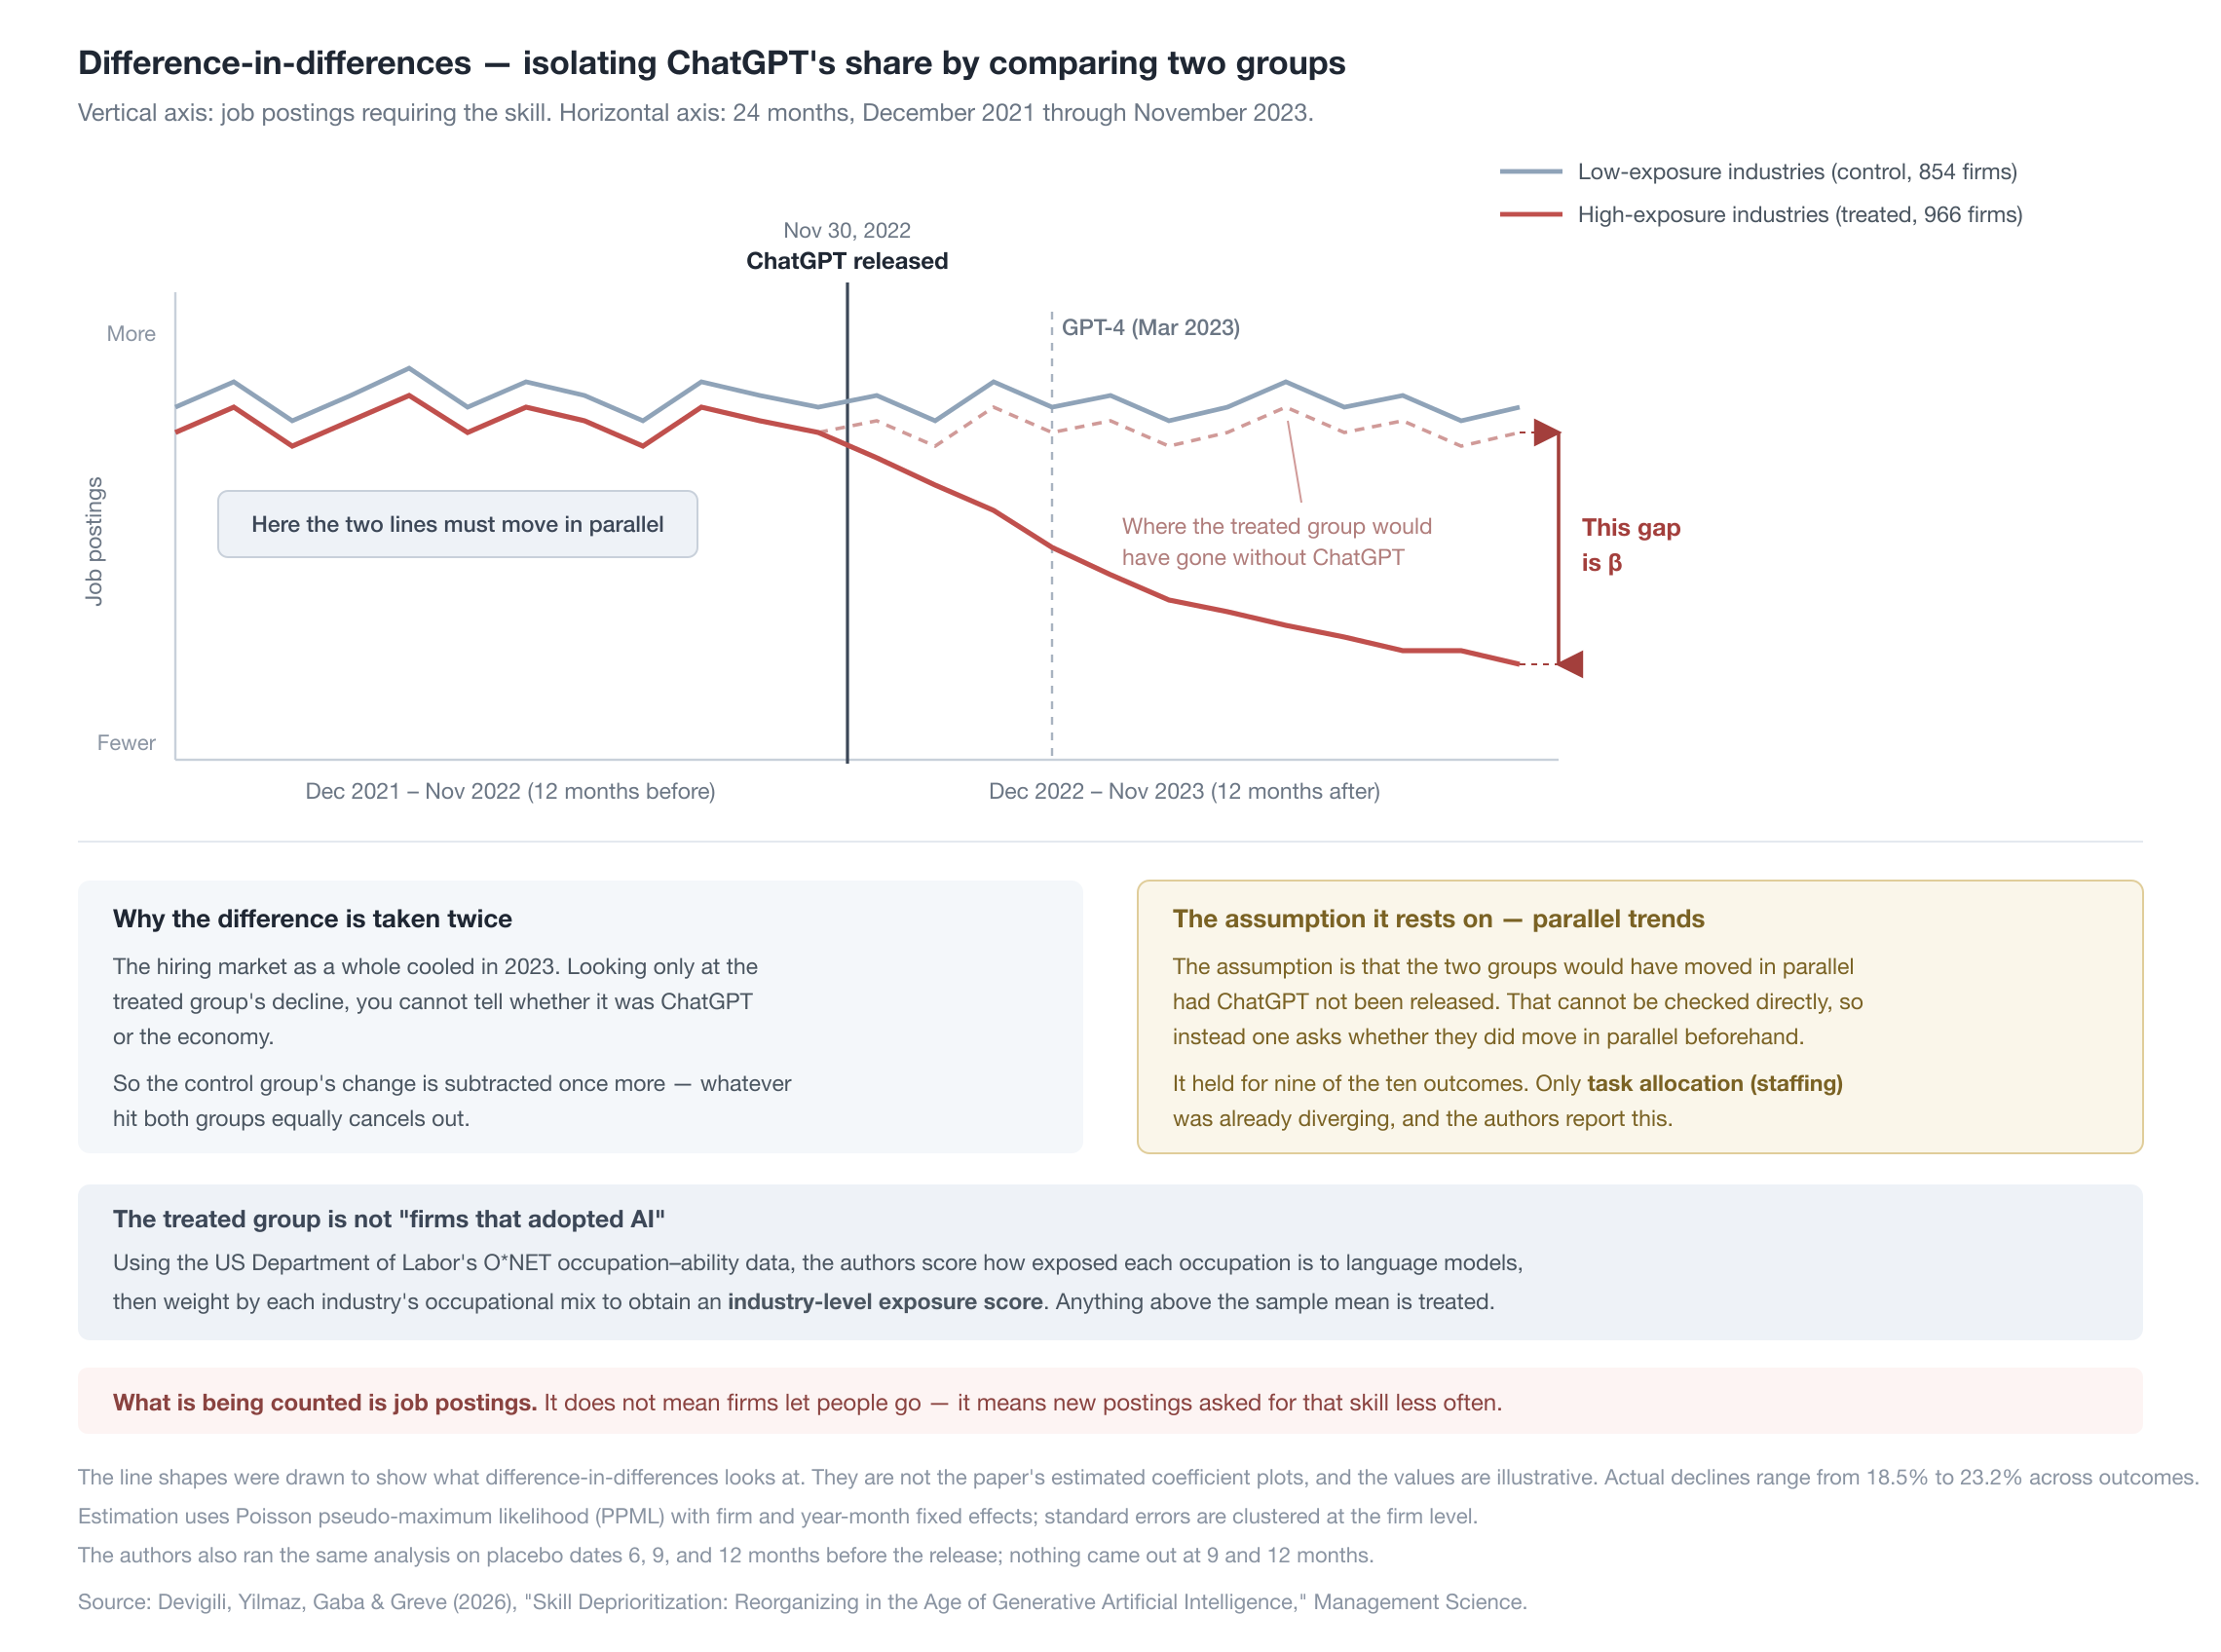
Figure 2. How this paper set up its difference-in-differences design — plotting job postings for high- versus low-exposure industries over 24 months. The two lines should move roughly in parallel before treatment, and the gap that opens after is β. The treated group is not “firms that adopted AI” but firms in industries whose occupational mix is more exposed to language models. The line shapes are drawn to illustrate the method; they are not the paper’s actual estimated-coefficient plot.
✔️ Findings
What skills were firms originally looking for?
First, the baseline: average postings per firm-month.
| Item | Avg. postings |
|---|---|
| Task division | 89.3 |
| Information provision (synchronous) | 75.5 |
| Exception management (operational) | 63.6 |
| Information provision (asynchronous) | 60.1 |
| Information provision (coordination) | 52.9 |
| Reward distribution (monitoring) | 24.6 |
| Exception management (conflict) | 13.7 |
| Task allocation (mapping) | 13.0 |
| Task allocation (staffing) | 5.1 |
| Reward distribution (incentives) | 1.4 |
Postings related to task division dominate overwhelmingly, while postings related to incentive design are barely posted at all. Fifty-three percent of sample firms were classified as belonging to high-exposure industries; the average firm has a log total assets of 7.87, a leverage ratio of 0.30, and 42% report R&D expenditure.
1 Baseline results — what shrank
The coefficients below are on a log scale and shouldn’t be read as-is; the actual rate of change is exp(β) − 1.
| Item | Coefficient | % change | Significance |
|---|---|---|---|
| Task division | −0.261 | −23.0% | p<0.001 |
| Reward distribution (monitoring) | −0.264 | −23.2% | p<0.001 |
| Information provision (asynchronous) | −0.241 | −21.4% | p<0.01 |
| Information provision (coordination) | −0.240 | −21.3% | p<0.01 |
| Exception management (operational) | −0.211 | −19.0% | p<0.01 |
| Information provision (synchronous) | −0.204 | −18.5% | p<0.05 |
| Exception management (conflict) | −0.224 | — | Not significant |
| Reward distribution (incentives) | −0.150 | — | Not significant |
| Task allocation (mapping) | −0.097 | — | Not significant |
| Task allocation (staffing) | +0.162 | — | Not significant |
All three of the theory’s predictions were confirmed in the data. Task division, and all three sub-items of information provision (coordination, synchronous, asynchronous), declined, and operational exception management — which was predicted to follow along with task division — declined as well. Monitoring within reward distribution declined too. By contrast, there was no significant change in task allocation (both staffing and mapping), incentives, or conflict resolution.
That said, conflict resolution needs a careful read. The coefficient itself (−0.224) is a similar magnitude to the other categories that did come out significant, but its standard error at 0.131 was large enough to miss the significance threshold — closer to “the data can’t tell us whether there was a change” than “there was no change.” Adding control variables leaves the results largely intact.
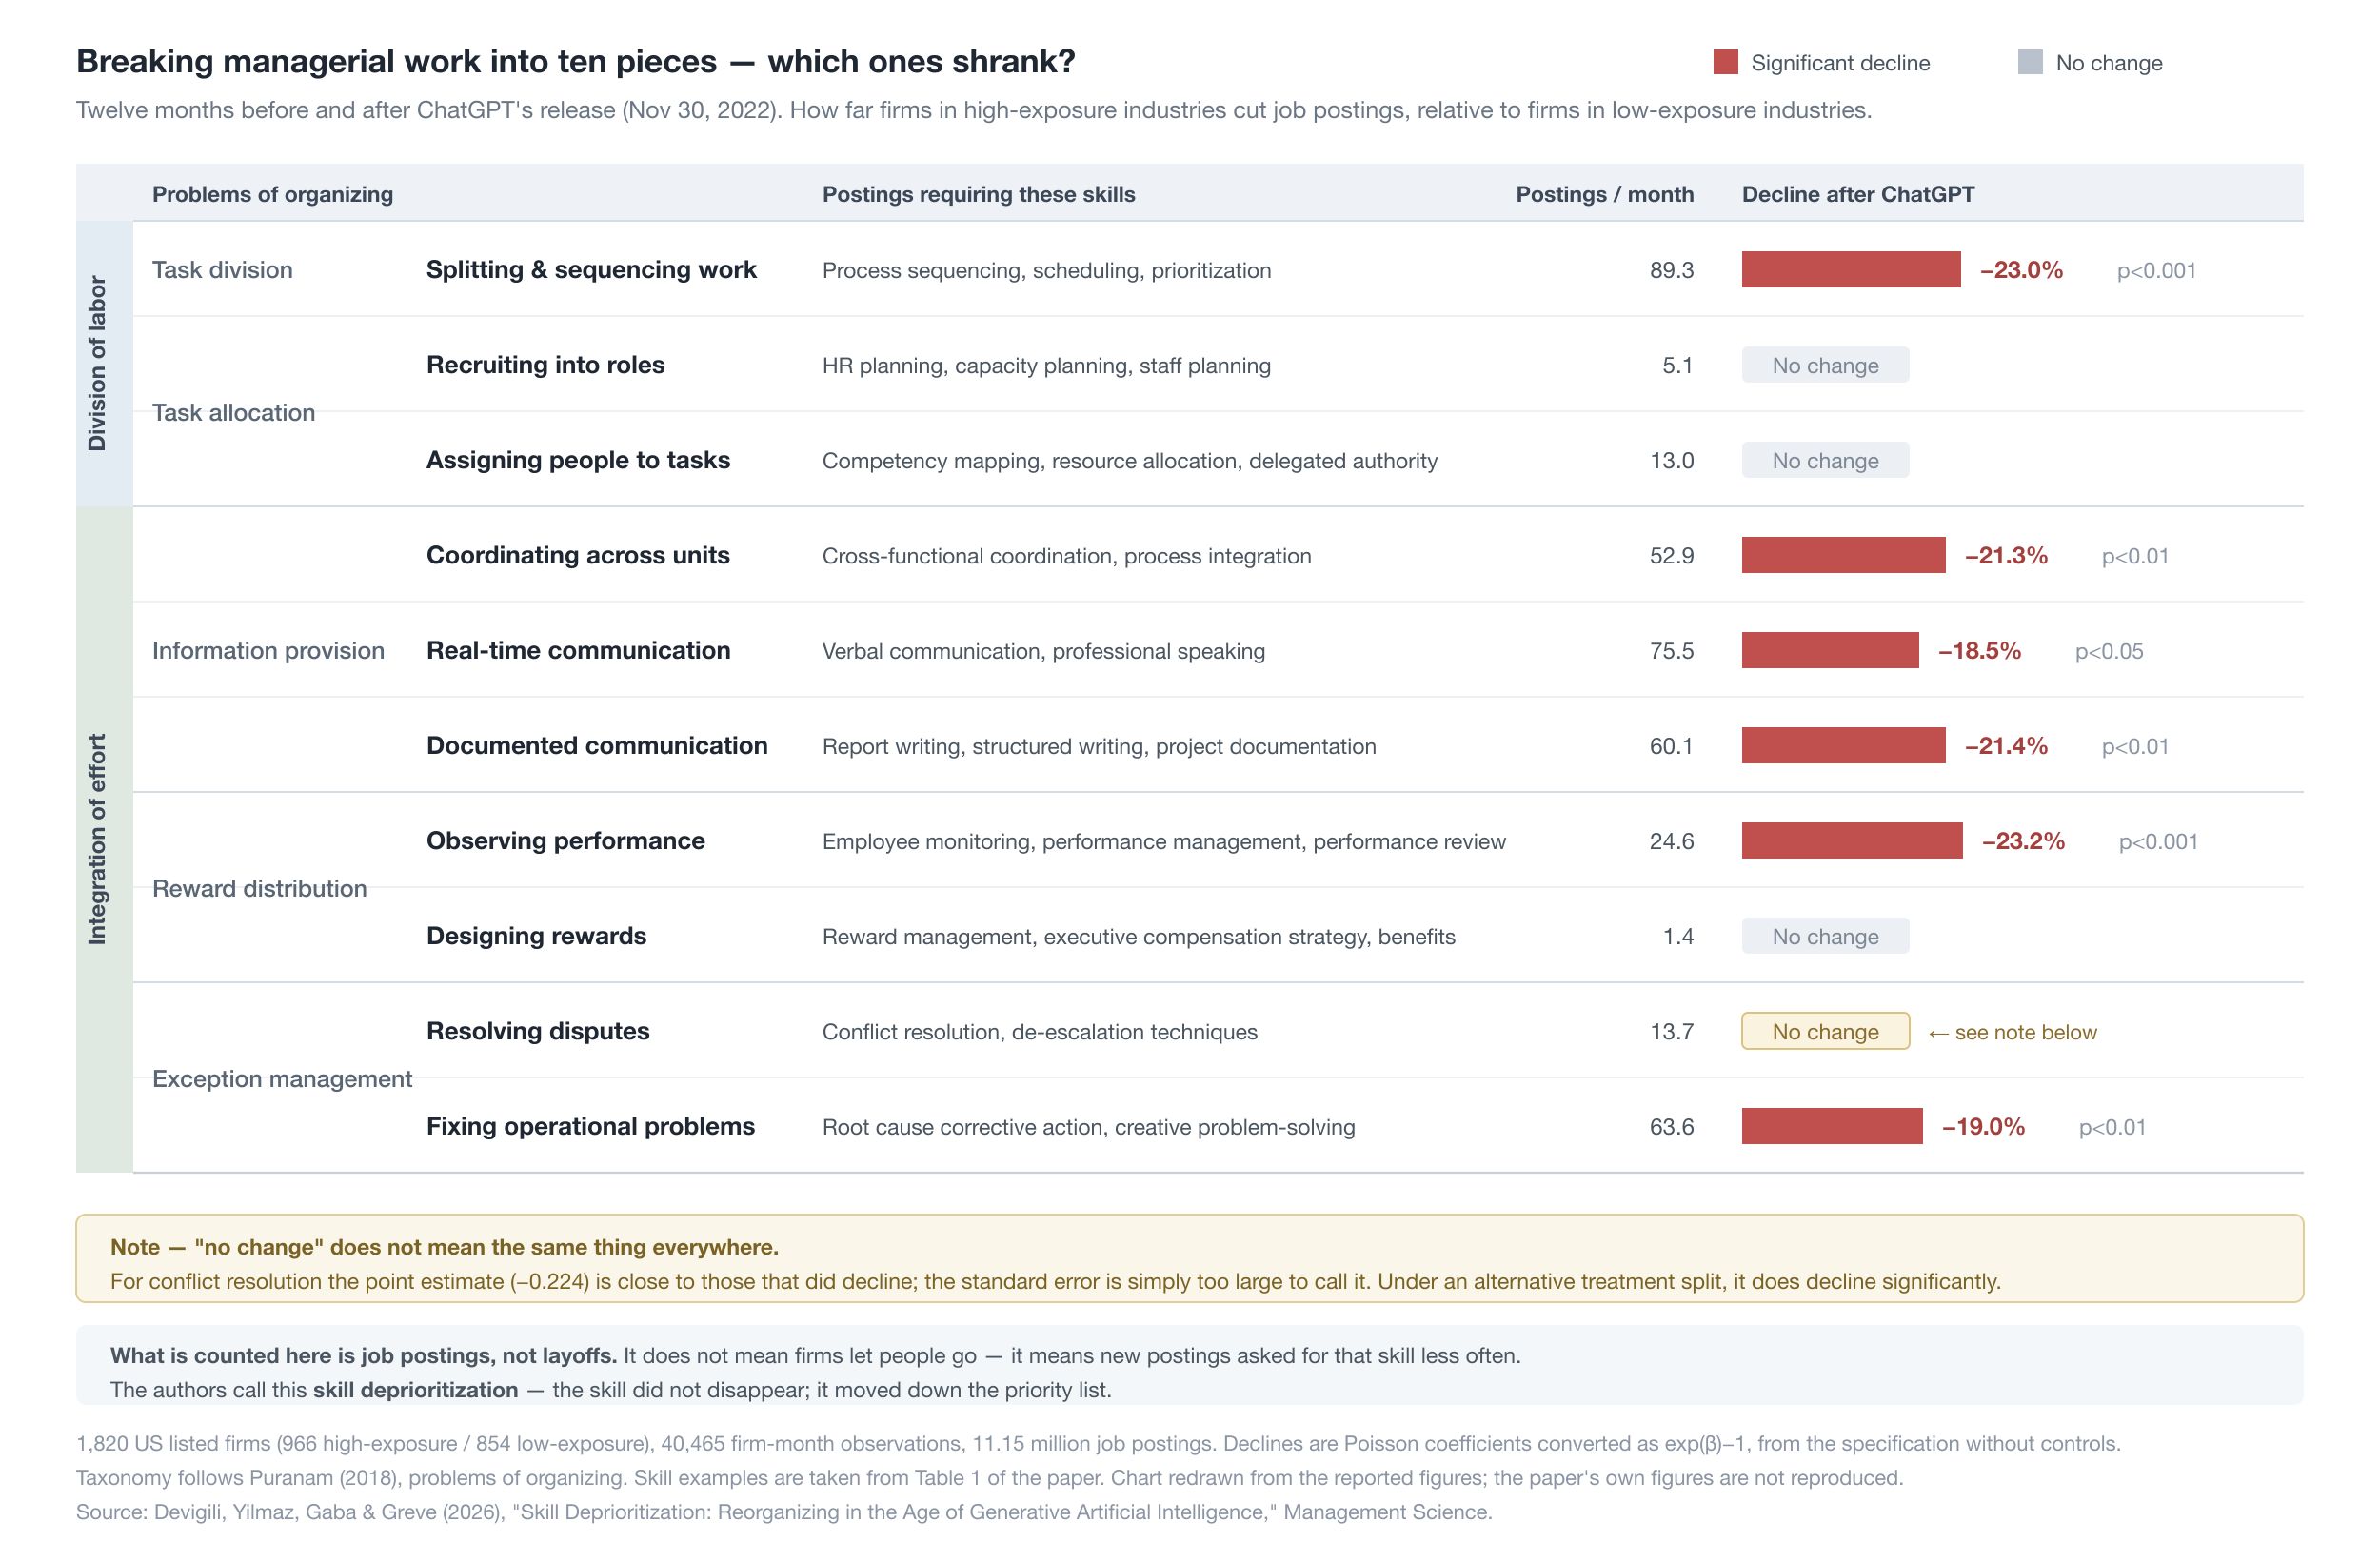
Figure 3. Breaking managerial work into ten pieces and asking which shrank — the twelve months before and after ChatGPT’s release, comparing postings for firms in high- versus low-exposure industries with controls omitted, exp(β)−1 basis. Conflict resolution’s estimate is a similar magnitude to the significant items but missed the significance threshold because of a large standard error (see “Note” below). The three unaffected items are the ones firms did not significantly reduce hiring for. The category framework follows Puranam (2018); the table redraws the paper’s own Table 3.
2 Did parallel trends hold?
Difference-in-differences rests on the assumption that “the two groups would have moved in parallel had ChatGPT not happened.” The authors broke out the pre-treatment period by month and tested whether the pre-treatment coefficients were all jointly zero, and this assumption was not rejected for most items. Task allocation (staffing) is the exception: the two groups were already moving differently before treatment, so the earlier “staffing showed no change” result rests on weaker footing than the other items.
3 What if exposure is treated as continuous, and GPT-3.5 is split from GPT-4?
Estimating with the industry’s continuous exposure value instead of the treated/control binary kept the results pointing in the same direction overall. Only information provision (synchronous, real-time communication) lost significance — a signal that this sub-item wobbles repeatedly across the robustness checks that follow as well.
Splitting the treatment period into the GPT-3.5 period (December 2022–February 2023) and the GPT-4 period (from March 2023 onward) produces a more interesting pattern.
| Item | GPT-3.5 period | GPT-4 period |
|---|---|---|
| Reward distribution (monitoring) | −0.164 (not sig.) | −0.291 (p<0.001) |
| Exception management (operational) | −0.150 (not sig.) | −0.230 (p<0.01) |
| Information provision (asynchronous) | −0.220 (p<0.05) | −0.250 (p<0.01) |
| Task division | −0.262 (p<0.01) | −0.260 (p<0.001) |
| Information provision (coordination) | −0.272 (p<0.05) | −0.225 (p<0.01) |
Monitoring and operational exception management are not significant during GPT-3.5 but become markedly stronger during GPT-4. This is read as a sign that actual improvement in AI capability, not novelty or hype, moved firms’ hiring behavior.
4 Placebo tests and falsification tests
A placebo test repeating the same analysis at fake event dates (6, 9, and 12 months before the actual release) produced no significant results at 9 or 12 months prior, and only one small, weakly significant coefficient at 6 months prior. Analyzing GitHub Copilot’s release the same way — a tool with a narrow, developer-focused user base — showed no comparable effect, as expected. Switching to a broader AI exposure measure not limited to language models produced similar results for task division, monitoring, and operational exception, but revealed a new significant effect for task allocation (mapping), which is left as a topic for future research. All three of these checks support that the original results aren’t due to chance.
5 Re-running with different estimation methods, classifications, and samples
The authors re-confirmed the results with a sensitivity analysis on violations of the parallel-trends assumption, a different estimator (ETWFE), keyword-based reclassification, excluding tech firms, redefining the treated group by a nonroutine-cognitive-occupation threshold, and matching similar firms via Coarsened Exact Matching (CEM), among other approaches.
Four items held significance across every check: task division, information provision (asynchronous), monitoring, and operational exception management — the paper’s most robust findings. By contrast, information provision (synchronous) and part of monitoring wobbled in significance depending on the check, and the conclusion for conflict resolution shifted depending on how the treated group was defined.
One result worth noting: collapsing the ten sub-items back into the five broad categories erases the internal differences within reward distribution and exception management (such as monitoring shrinking while incentives didn’t). This is exactly why the paper broke things down into ten categories in the first place.
6 Supplementary analysis — was this just an overall cut to hiring?
Controlling for total hiring demand and re-estimating leaves the declines in coordination and task division intact, showing these skills were pushed out relatively more independent of any overall cut to hiring. Comparing managerial postings against nonmanagerial ones, the higher a firm’s exposure, the more its share of managerial postings shrank — consistent with the span-of-control logic described above. At the same time, postings requiring GenAI-related skills rose sharply, led by high-exposure firms, which is itself evidence that the treated and control groups were correctly separated.
✔️ Conclusion
Over the year following ChatGPT’s release, U.S. publicly listed firms in high-exposure industries cut postings requiring skills that break down and organize work (−23%), convey information (−18–21%), observe performance (−23%), and handle operational problems (−19%), relative to firms in low-exposure industries. Postings requiring the skill to hire and place people, to design reward systems, or to resolve conflict did not change in a statistically meaningful way.
The significance of this result is that the prediction was built before the data was even examined. The authors modeled the organization as a queue, predicted that “functions where AI reduces the variability of processing time will see demand fall first,” and only then checked the data — and the actual result matched that prediction’s direction. The authors don’t claim firms are behaving fully optimally, but this paper shows the queuing model is a useful first approximation for explaining the initial reaction.
The limits the authors themselves note: first, treatment was defined at the industry level, not the individual firm, so differences in how fast firms within the same industry actually adopt AI go uncaptured — and the more that actual AI users are mixed into the control group, the smaller the gap between treated and control, so if anything this likely understates rather than overstates the true effect. Second, the observation window covers only 12 months after ChatGPT’s release, so it wasn’t possible to observe firms actually redesigning their organizational structure. What’s confirmed here is the first-order reaction visible in job postings; the second-order effect of organizational structure itself changing is expected to unfold over the coming years.
Even so, this paper’s contribution is clear. Until now, “AI will take our jobs” was mostly discussed at the level of occupation titles. This paper shifts that lens down one level, to the kinds of managerial work done within a job — meaning a question less like “which job should I choose” and more like “which kind of judgment within that job should I take responsibility for” may become the more pertinent one for anyone planning a career. This paper lays the groundwork for the next step: re-measuring that second-order effect using the same method, at the level of the firm.
✔️ References
- Queuing theory — the industrial-engineering tool for problems of waiting in line. The backbone of this paper’s theory.
- Difference-in-differences — this paper’s primary estimation method.
- O*NET — the U.S. Department of Labor’s occupation-ability database. The starting point for measuring exposure.
- Felten, E. W., Raj, M., & Seamans, R. (2021). Occupational, industry, and geographic exposure to artificial intelligence: A novel dataset and its potential uses. Strategic Management Journal, 42(12), 2195–2217. — the original paper behind AI Occupational Exposure (AIOE).
- Latent Dirichlet Allocation (LDA) — the topic model used to narrow down skill candidates.
- Cohen’s kappa — the metric for how much two people’s classifications agree.
- Lightcast — the job-postings database.
- Atlassian, “AI-powered project management” — the product page introducing Jira’s built-in generative AI feature, describing how it automatically breaks a plain-language goal down into subtasks and dependencies. (Source for the task division example.)
- TechCircle, “11 companies using GPT-4 in consumer products” (March 16, 2023) — an article covering 11 companies that applied GPT-4 to their products, including Stripe’s use of it internally to scan documents and code and flag error patterns. (Source for the operational exception management example.)
- FedScoop, “State Department encouraging workers to use ChatGPT” — an article reporting that the U.S. State Department deployed an internal GenAI chatbot for 1,000 staff in 2024, used for summarizing policy documents and translation. (Source for the information provision example.)
- SHRM, “How HR is using generative AI for performance management” — an article covering the HR analytics tool Culture Amp’s experiment using ChatGPT to compile Slack kudos, customer comments, and peer feedback into a performance summary. (Source for the monitoring example.)
Devigili, M., Yilmaz, E. D., Gaba, V., & Greve, H. (2026). Skill Deprioritization: Reorganizing in the Age of Generative Artificial Intelligence. Management Science, 0(0).
✔️ 소개 및 요약
이번에 다룰 논문은 생성형 AI가 등장한 뒤 기업이 어떤 관리 인력을 덜 찾게 되는지를 실증적으로 분석한다.
“AI가 일자리를 없앤다”는 말은 이제 흔하지만, 정작 기업이 채용을 줄인다면 정확히 어떤 능력부터, 왜 그 능력부터 줄이는지는 답하지 않는다. 저자들은 이 현상을 기술 우선순위 하락(skill deprioritization)이라 부른다. 즉, 생성형 AI가 충분히 대신할 수 있는 인간의 능력에 대해 기업의 채용 수요가 체계적으로 줄어드는 것이다. 기존 연구가 주로 AI를 쓰면 사람이 일을 얼마나 더 잘하게 되는지(역량 보강, augmentation)나 어떤 능력을 새로 길러야 하는지(재교육, reskilling)를 다뤄온 것과 달리, 이 논문은 “기업이 무엇을 더 이상 찾지 않는지”를 묻는다.
이 정의에서 중요한 것은, 논문이 측정하는 것이 채용 공고이지 고용 인원이나 해고가 아니라는 점이다. 예전에는 영업직이나 배달직 채용 공고에 “지리에 밝은 사람”이라는 조건이 흔히 붙었지만 내비게이션 앱이 보편화된 뒤 이 조건은 공고에서 점차 사라졌다. 기업이 이미 일하던 사람을 내보낸 것이 아니라, 새로 뽑을 때 그 조건을 요구하지 않게 된 것이다. 이 논문이 다루는 변화가 바로 이런 종류다.
저자들은 조직이론의 관리자 업무 분류 체계와 산업공학의 대기행렬 이론(queuing theory)을 결합해 어떤 능력부터 줄어들지 예측하고, ChatGPT 출시를 자연실험으로 삼아 이중차분법(difference-in-differences)으로 미국 상장기업의 채용 공고 1,115만 4,915건에서 그 예측을 검증했다.
결과를 요약하면, ChatGPT 출시 뒤 생성형 AI 노출도가 높은 산업에 속한 기업들은, 노출도가 낮은 산업의 기업들과 비교했을 때, 업무를 세분화하고 순서를 정리하는 능력을 요구하는 공고가 23% 줄었다. 정보를 전달하는 능력(약 18~21%)과 성과를 관찰·평가하는 능력(약 23%), 운영상의 문제를 수습하는 능력(약 19%)을 요구하는 공고도 함께 줄었다. 반면 사람을 뽑아 자리에 앉히는 능력, 보상 제도를 설계하는 능력, 갈등을 조정하는 역할을 요구하는 공고는 통계적으로 의미 있게 변하지 않았다.
✔️ 연구 내용 및 논리
기존 연구는 어디까지 와 있었나
AI와 일에 대한 기존 연구는 대체로 과업(task) 단위로 진행되어 왔다. 특정 과업을 AI가 대신할 수 있는가, 사람이 AI를 쓰면 그 과업을 얼마나 빨리, 얼마나 정확하게 하는가를 다뤘다. 여기에 다른 관점이 더 필요하다는 것이 저자들의 문제의식이다. 범용 기술(general-purpose technology)은 조직 자체를 함께 바꿔야 효과가 난다. David(1990)에 따르면 공장에 전기 모터를 들여놓는 것만으로는 생산성이 오르지 않았고, 공장 배치를 다시 설계하고 나서야 생산성 향상이 나타났다. 이 논리를 그대로 적용하면, 생성형 AI가 개별 과업의 처리 속도를 얼마나 높이는지만 봐서는 조직 차원의 변화를 알 수 없다. 그 변화를 관찰할 창구로 저자들이 고른 것이 기업의 채용 수요다.
관리자가 하는 일을 어떻게 나눌 것인가
이 논문은 일의 내용이 아니라 “여러 사람이 함께 일하려면 무엇을 해결해야 하는가”를 기준으로 나누는 Puranam(2018)의 조직화 문제(problems of organizing) 틀을 쓴다. 크게 분업(division of labor)과 노력의 통합(integration of effort)으로 나뉘고, 다시 다섯 갈래, 열 개 하위 항목으로 세분화된다.
| 대분류 | 하위 항목 | 내용 |
|---|---|---|
| 과업 분할 | — | 목표를 실행 가능한 조각으로 쪼개고 순서·우선순위를 매기는 일 |
| 과업 배분 | 충원 / 매핑 | 그 조각을 누구에게 줄지 정하는 일 |
| 정보 제공 | 조정 / 동기적 소통 / 비동기적 소통 | 필요한 정보가 흐르게 하는 일 |
| 보상 분배 | 모니터링 / 인센티브 | 목표에 맞게 움직이도록 이끄는 일 |
| 예외 관리 | 갈등 조정 / 운영 예외 관리 | 예상 못한 일을 수습하는 일 |
이렇게 세분화한 이유는 “생성형 AI가 운영상 예외 관리에는 영향을 주지만 갈등 조정에는 영향을 주지 않을 것”처럼 더 구체적인 예측이 가능해지고, 측정 면에서도 각 항목이 서로 겹치지 않게 정의되기 때문이다.
대기행렬 이론으로 무엇이 먼저 줄어들지 예측하기
이제 이 열 개 항목 중 어느 것이 먼저 줄어들지 예측할 차례다. 이때 동원한 도구가 대기행렬 이론(queuing theory)이다. 손님이 도착하는 속도, 창구 직원 한 명이 처리하는 데 걸리는 평균 시간, 그 처리 시간이 얼마나 일정하지 않은지를 알면 평균 대기 시간을 계산할 수 있다는 이론으로, 글린 외(Glynn et al., 2020)는 이를 조직에 적용해 기업에 도착하는 문제(의사결정이 필요한 사안)와 그것을 처리하는 사람들을 각각 손님과 창구 직원으로 놓았다.
한 사람이 문제를 더 빨리 처리하면 같은 일을 더 적은 인원으로 해낼 수 있다는 것이 가장 단순한 예측이지만, 이 효과는 열 개 항목 모두에 비슷하게 적용되어 어느 항목이 상대적으로 더 취약한지는 가려내지 못한다. 그래서 논문은 다음의 더 구체적인 예측 세 가지를 제시한다.
1 과업 분할과 운영 예외 관리가 함께 줄어든다는 예측
AI를 쓰는 사람은 더 넓은 범위의 문제를 혼자 다룰 수 있어, 일을 잘게 쪼개 나눠 줄 필요와 그 진행을 지켜볼 필요가 함께 줄어든다는 논리다. 실제로 프로젝트 관리 소프트웨어 Jira의 생성형 AI 기능은 목표 문장을 넣으면 하위 작업과 의존 관계를 자동으로 만들어준다.
2 정보 제공이 줄어든다는 예측
지금까지는 조직이 정보를 정리해 구성원에게 밀어주는(push) 방식이 일반적이었지만, 생성형 AI가 있으면 필요한 사람이 그때그때 직접 끌어올(pull) 수 있다. 미국 국무부는 2024년 내부 생성형 AI 챗봇을 도입해 정책 문서 요약과 번역에 활용한 사례로 언급된다.
3 모니터링이 줄어든다는 예측
성과를 기록하는 기술 자체는 이미 오래전부터 갖춰져 있었지만, 그 데이터를 읽어 판단으로 바꾸는 역할은 여전히 사람 몫이었다. 생성형 AI는 이 빈틈을 메운다는 것이다. HR 분석 도구 Culture Amp가 ChatGPT로 Slack 칭찬 기록, 고객 코멘트, 동료 피드백을 모아 성과 요약을 자동 생성하는 실험을 한 사례가 그 예로 제시된다.
반대로 과업 배분(충원·매핑), 인센티브 설계, 갈등 조정은 줄어들 근거가 약하다. 사람이 AI를 쓰게 됐다고 해서 적합한 사람을 고르고 동기를 부여하는 일 자체의 성격이 바뀌지는 않기 때문이다. 다만 조직 구조 자체를 다시 짜는 2차 효과가 일어난다면 이들도 줄어들 수 있는데, 그런 효과는 실험·학습·실행에 시간이 걸리므로 ChatGPT 출시 직후인 이 논문의 관찰 기간에는 나타나기 어려울 것으로 예상된다.
왜 이것이 “재조직”인가 — 통제 범위 이야기
논문 제목의 “Reorganizing(재조직)”은 기술 수요 하락이 왜 조직 개편과 연결되는지를 가리킨다. 이 연결 고리를 설명하는 개념이 통제 범위(span of control), 즉 관리자 한 명이 직접 관리하는 부하 직원의 수다. 통제 범위는 (i) 관리자가 승인해야 할 결정이 얼마나 자주 올라오는가와 (ii) 결정 하나를 처리하는 시간이 얼마나 들쭉날쭉한가로 정해지는데, 이 논문이 주목하는 것은 (ii)다. 대기행렬 이론에 따르면 평균 대기 시간은 처리 시간이 짧아지는 것만이 아니라 처리 시간이 일정해지는 것 자체로도 줄어든다. 생성형 AI가 조정 업무의 일부를 가져가면 관리자에게 남는 일의 처리 시간 변동성이 줄고, 그 여유만큼 관리자 한 명이 더 많은 부하 직원을 받을 수 있게 된다.
✔️ 데이터 및 방법론
무엇을 어디서 모았나
표본은 미국 상장기업 1,820곳이며, 기업-월 단위로 40,465개 관측치다. 세 곳의 데이터를 결합했다. Lightcast는 미국 채용 시장을 매일 수집하는 채용 공고 데이터베이스로, 공고마다 어떤 스킬을 요구하는지가 태그로 붙어 있어 이 논문의 종속변수가 모두 여기서 나온다. Compustat은 분기 재무 데이터를, Revelio는 기업별 월별 인원 수 데이터를 제공해 각각 통제변수로 쓰였다.
관찰 기간은 ChatGPT가 공개된 2022년 11월 30일을 기준으로 전후 각 12개월이다(2021년 12월~2022년 11월, 2022년 12월~2023년 11월). 이전 기간은 비교 기준선을 잡을 만큼 길되 그 이전의 AI 발전에 영향받지 않을 만큼 최근이어야 하고, 이후 기간은 기업이 반응할 시간은 충분하되 다른 사건이 끼어들 만큼 길어서는 안 된다는 것이 이 기간을 고른 이유다.
“노출도 높은 산업”은 어떻게 정했나
이 논문의 처리군(treated group)은 AI를 실제로 도입한 기업이 아니다. 이 점이 헷갈리기 쉬운 대목이다. 저자들이 쓴 것은 펠튼 외(Felten et al., 2021/2023)가 제시한 AI 직업 노출도(AIOE, AI Occupational Exposure)다. 미국 노동부의 O*NET 데이터베이스에는 800개가 넘는 직업이 52가지 능력과 어떻게 연결되는지가 정리돼 있는데, 여기에 “이 52가지 능력이 특정 AI 기능에 얼마나 노출돼 있는가”를 설문조사로 물어 만든 행렬을 곱해 직업별 노출도를 계산한다. 이 논문은 그중 언어 모델링(language modeling) AI 기능에 대한 노출도만 골라 썼다.
여기서 k는 직업, j는 52가지 능력 중 하나, A는 능력 j가 언어 모델링 AI에 얼마나 노출돼 있는지, L·I는 직업 k에서 능력 j가 얼마나 중요하고 자주 쓰이는지를 뜻한다. 이 직업 단위 값을 산업 단위로 올리기 위해 Lightcast로 4자리 NAICS 산업별·직업별 월간 공고 수를 집계하고 각 산업 안에서 각 직업이 차지하는 비중을 구해 가중한 뒤, ChatGPT 이전 기간의 월별 값을 평균 내 산업별 노출도를 정했다. 그 값이 표본 평균을 넘으면 처리군으로 분류했고, 결과는 처리군 966곳, 대조군 854곳으로 거의 반반으로 갈렸다. 정리하면, 이 논문이 가른 기준은 “이 기업이 AI를 도입했는가”가 아니라 “이 기업이 속한 산업의 직업 구성이 언어 모델에 얼마나 물려 있는가”다.
채용 공고 속 33,832개 기술을 열 갈래로 분류하는 일
Lightcast의 기술 분류 체계(9.25판)에는 33,832개의 개별 기술(skill)이 있고, 각각에 70단어 남짓한 설명이 붙어 있다. 저자들은 이를 앞서 정한 열 개 항목으로 분류하기 위해 다단계 절차를 거쳤다. 먼저 토픽 모델(LDA)로 조직화 항목과 관련 있는 기술 후보 1,765개를 추리고, 저자들이 이를 직접 읽어 라벨을 정한 뒤 연구 보조원의 독립 분류(코헨의 카파 0.79)로 일치도를 확인했다. 이렇게 확정한 분류 기준을 GPT-4o 에이전트 세 개에 학습시켜 전체 33,832개 기술에 확대 적용했고(정확도 93%, F1 89%), 마지막으로 사람이 다시 최종 확인해 657개 기술, 719개의 기술-라벨 연결을 확정했다. 이 분류를 적용해 처리한 공고가 1,115만 4,915건이며, 공고 하나가 여러 항목에 걸릴 수 있어 항목별 건수는 서로 배타적이지 않다.
대기행렬 모형의 수식
앞서 「연구 내용 및 논리」에서 언급한 통제 범위 부분을 수식으로 풀어보자. 문제가 관리자에게 평균 빈도 λ로 도착하고, 처리 시간은 평균 1/μ, 분산 σ²인 분포를 따른다고 하자. 생성형 AI가 조정 업무 중 φ만큼을 가져가면 남는 분산은 다음과 같다.
이런 형태의 대기행렬(M/G/1)에서 평균 대기 시간은 다음과 같다.
유념할 것은 분자에 σ²가 있다는 점이다. 처리 시간이 짧아지는 것만이 아니라, 처리 시간의 변동성이 줄어드는 것 자체가 대기 시간을 줄인다. φ가 커지면 대기 시간이 줄고, 그 여유만큼 부하 직원을 더 받을 수 있다. 저자들이 정리한 추가 수용 가능 인원은 다음과 같다.
여기서 Δn은 대기 시간을 늘리지 않고 더 받을 수 있는 부하 직원 수이고, λ̄는 부하 직원 한 명이 만들어 내는 평균 도착률이다. 원래 처리 시간의 변동성이 심했던 조직일수록, 그리고 관리자가 이미 포화 상태에 가까웠던 조직일수록 이 효과가 크다.
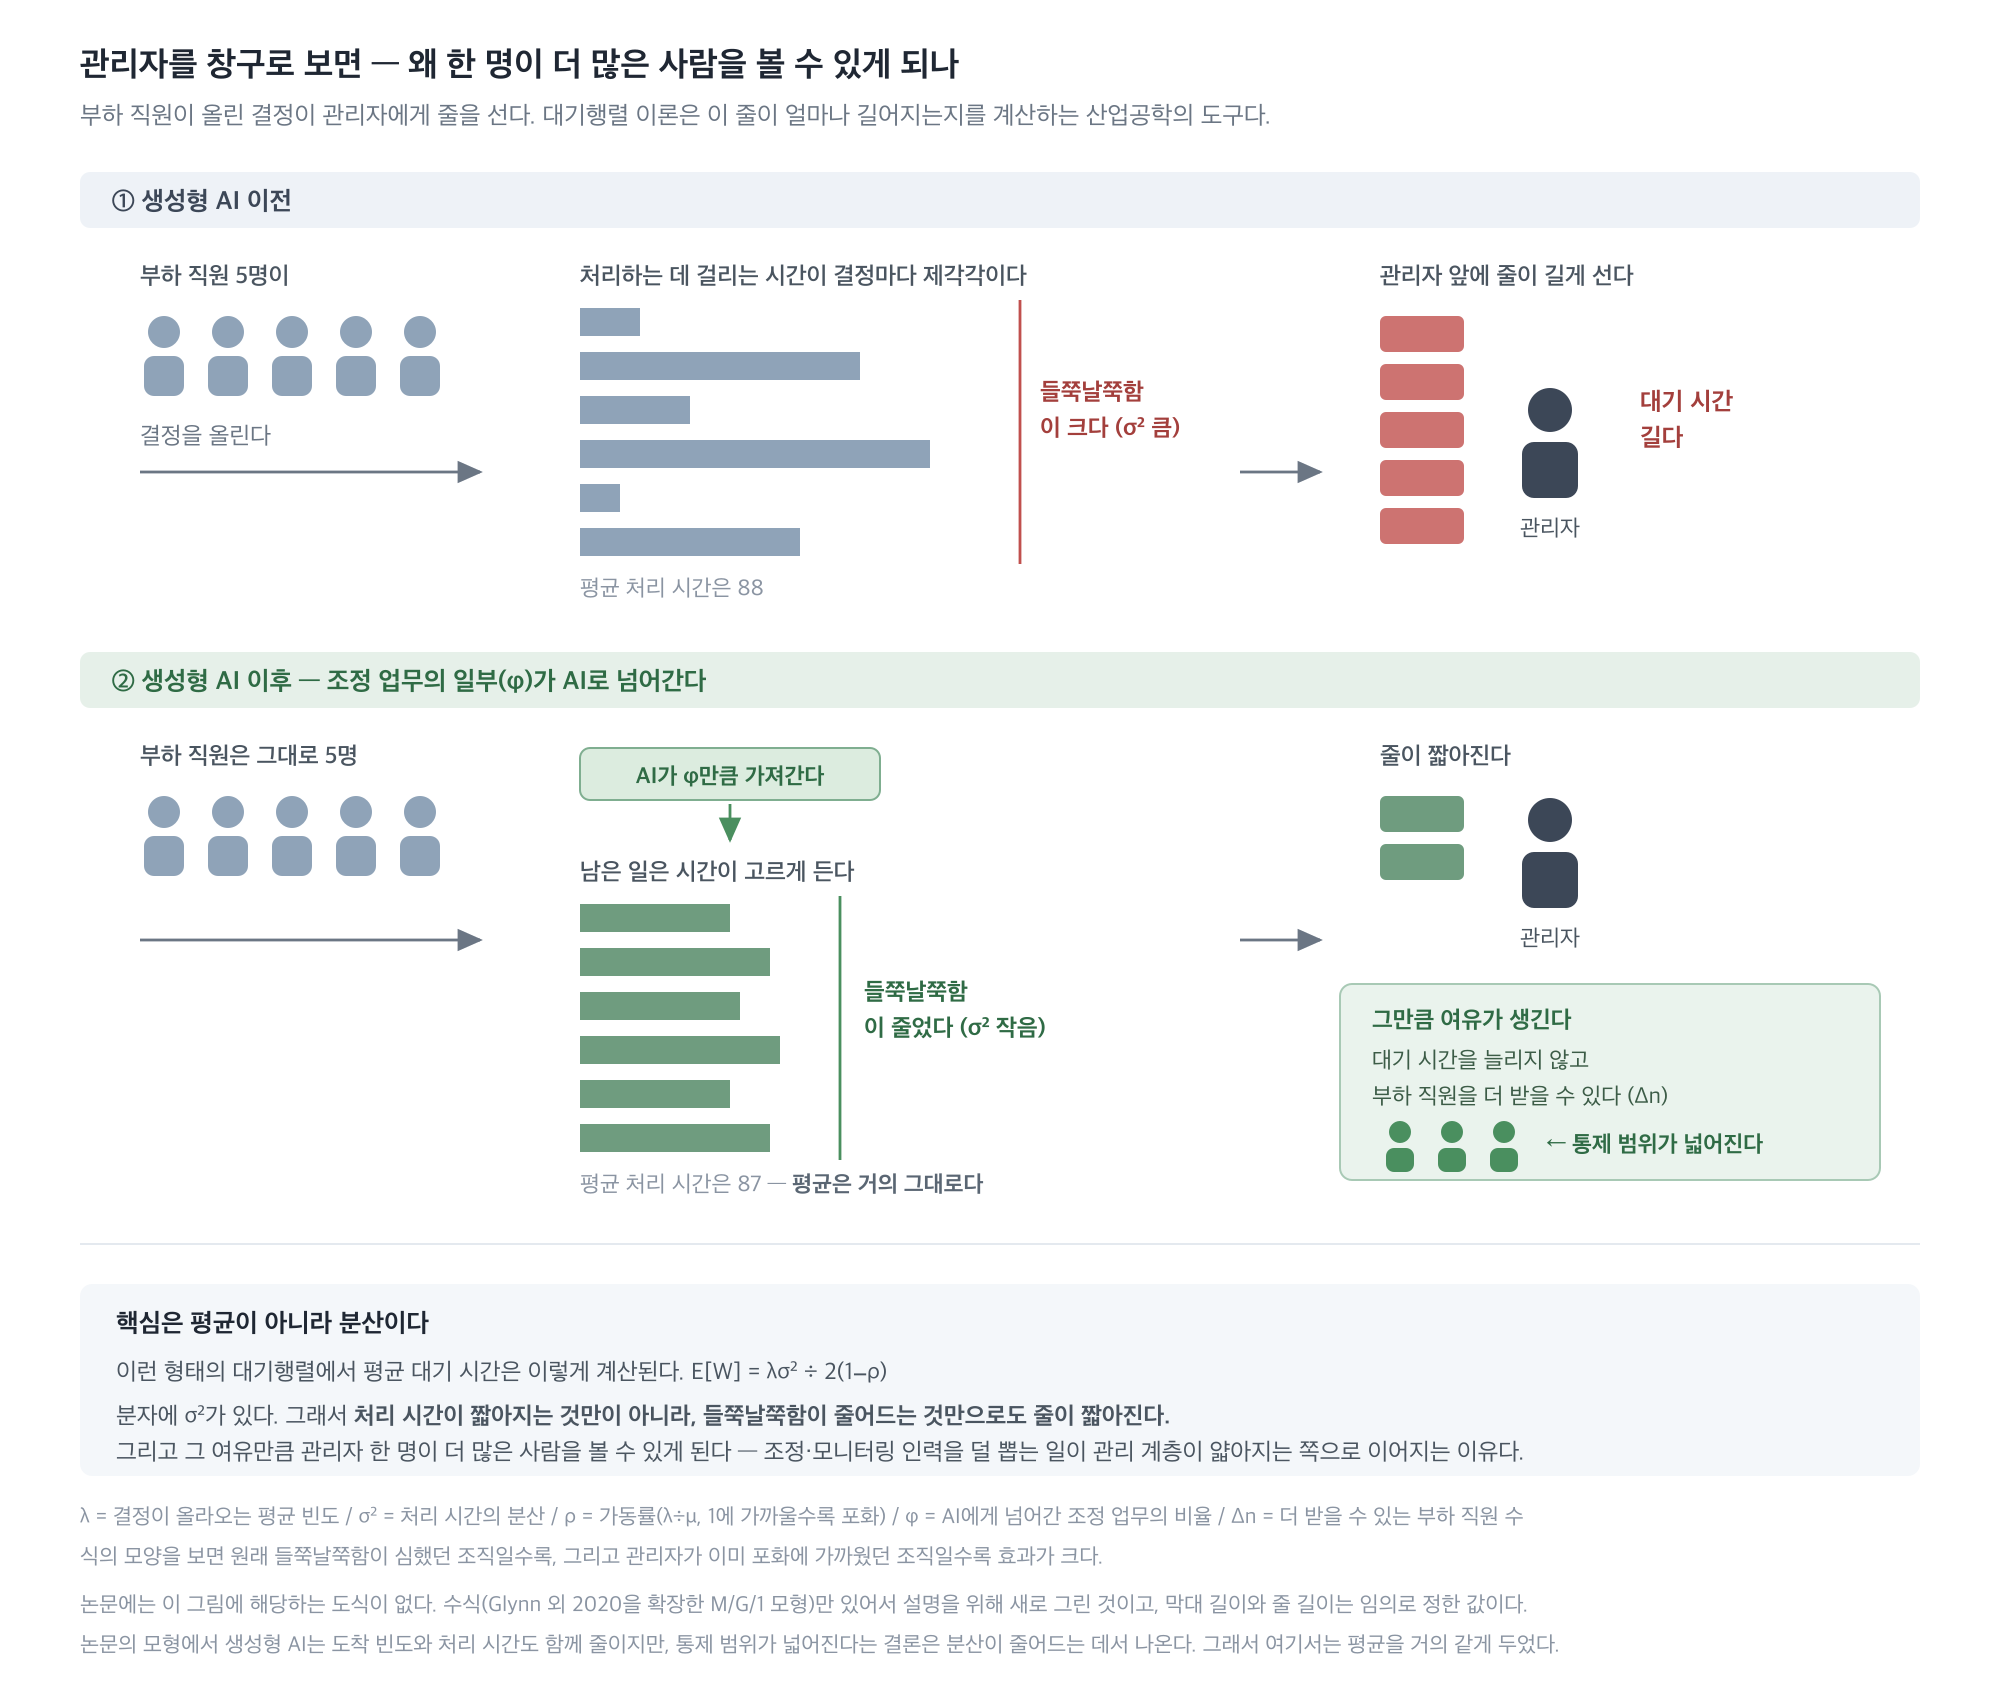
그림 1. 관리자를 창구로 보면 — 부하 직원이 올린 결정이 관리자에게 줄을 선다. 생성형 AI가 조정 업무의 일부를 가져가면, 남은 일에 걸리는 시간의 들쭉날쭉함이 줄어든다. 평균이 그대로여도 그것만으로 줄이 짧아지고, 그 여유만큼 관리자 한 명이 더 많은 사람을 볼 수 있게 된다.
어떻게 추정했나
이중차분법(difference-in-differences, DiD)을 썼다. 노출도가 높은 산업에 속한 기업의 ChatGPT 이후–이전 변화에서, 노출도가 낮은 산업에 속한 기업의 같은 변화를 빼는 방법으로, 해당 기간에 모든 기업에 공통으로 작용한 요인(경기, 채용 시장 전반의 흐름)을 상쇄한다.
y는 기업 i가 t월에 올린 공고 중 해당 기술을 요구하는 건수, Treated는 노출도 높은 산업에 속하면 1, PostGPT는 2022년 12월 이후면 1이다.
추정은 포아송 유사최대우도(PPML)로 했는데, 종속변수가 0이 많은 건수 자료를 무리한 변환 없이 다룰 수 있고, 자료가 실제로 포아송 분포를 따르지 않아도 일관된 추정치를 주며, 분산이 고르지 않은 상황에도 견디기 때문이다. 표준오차는 기업 단위로 묶어 계산했다.
통제변수는 규모(총자산 로그), ROA, 부채비율, 총자산 대비 R&D, R&D 지출 여부 더미, 총자산 대비 설비투자, 그리고 인력 변화율이다. 인력 변화율을 넣은 이유는, 대규모 정리해고를 진행 중인 기업은 AI와 무관하게 공고 자체가 줄어들 수 있기 때문이다.
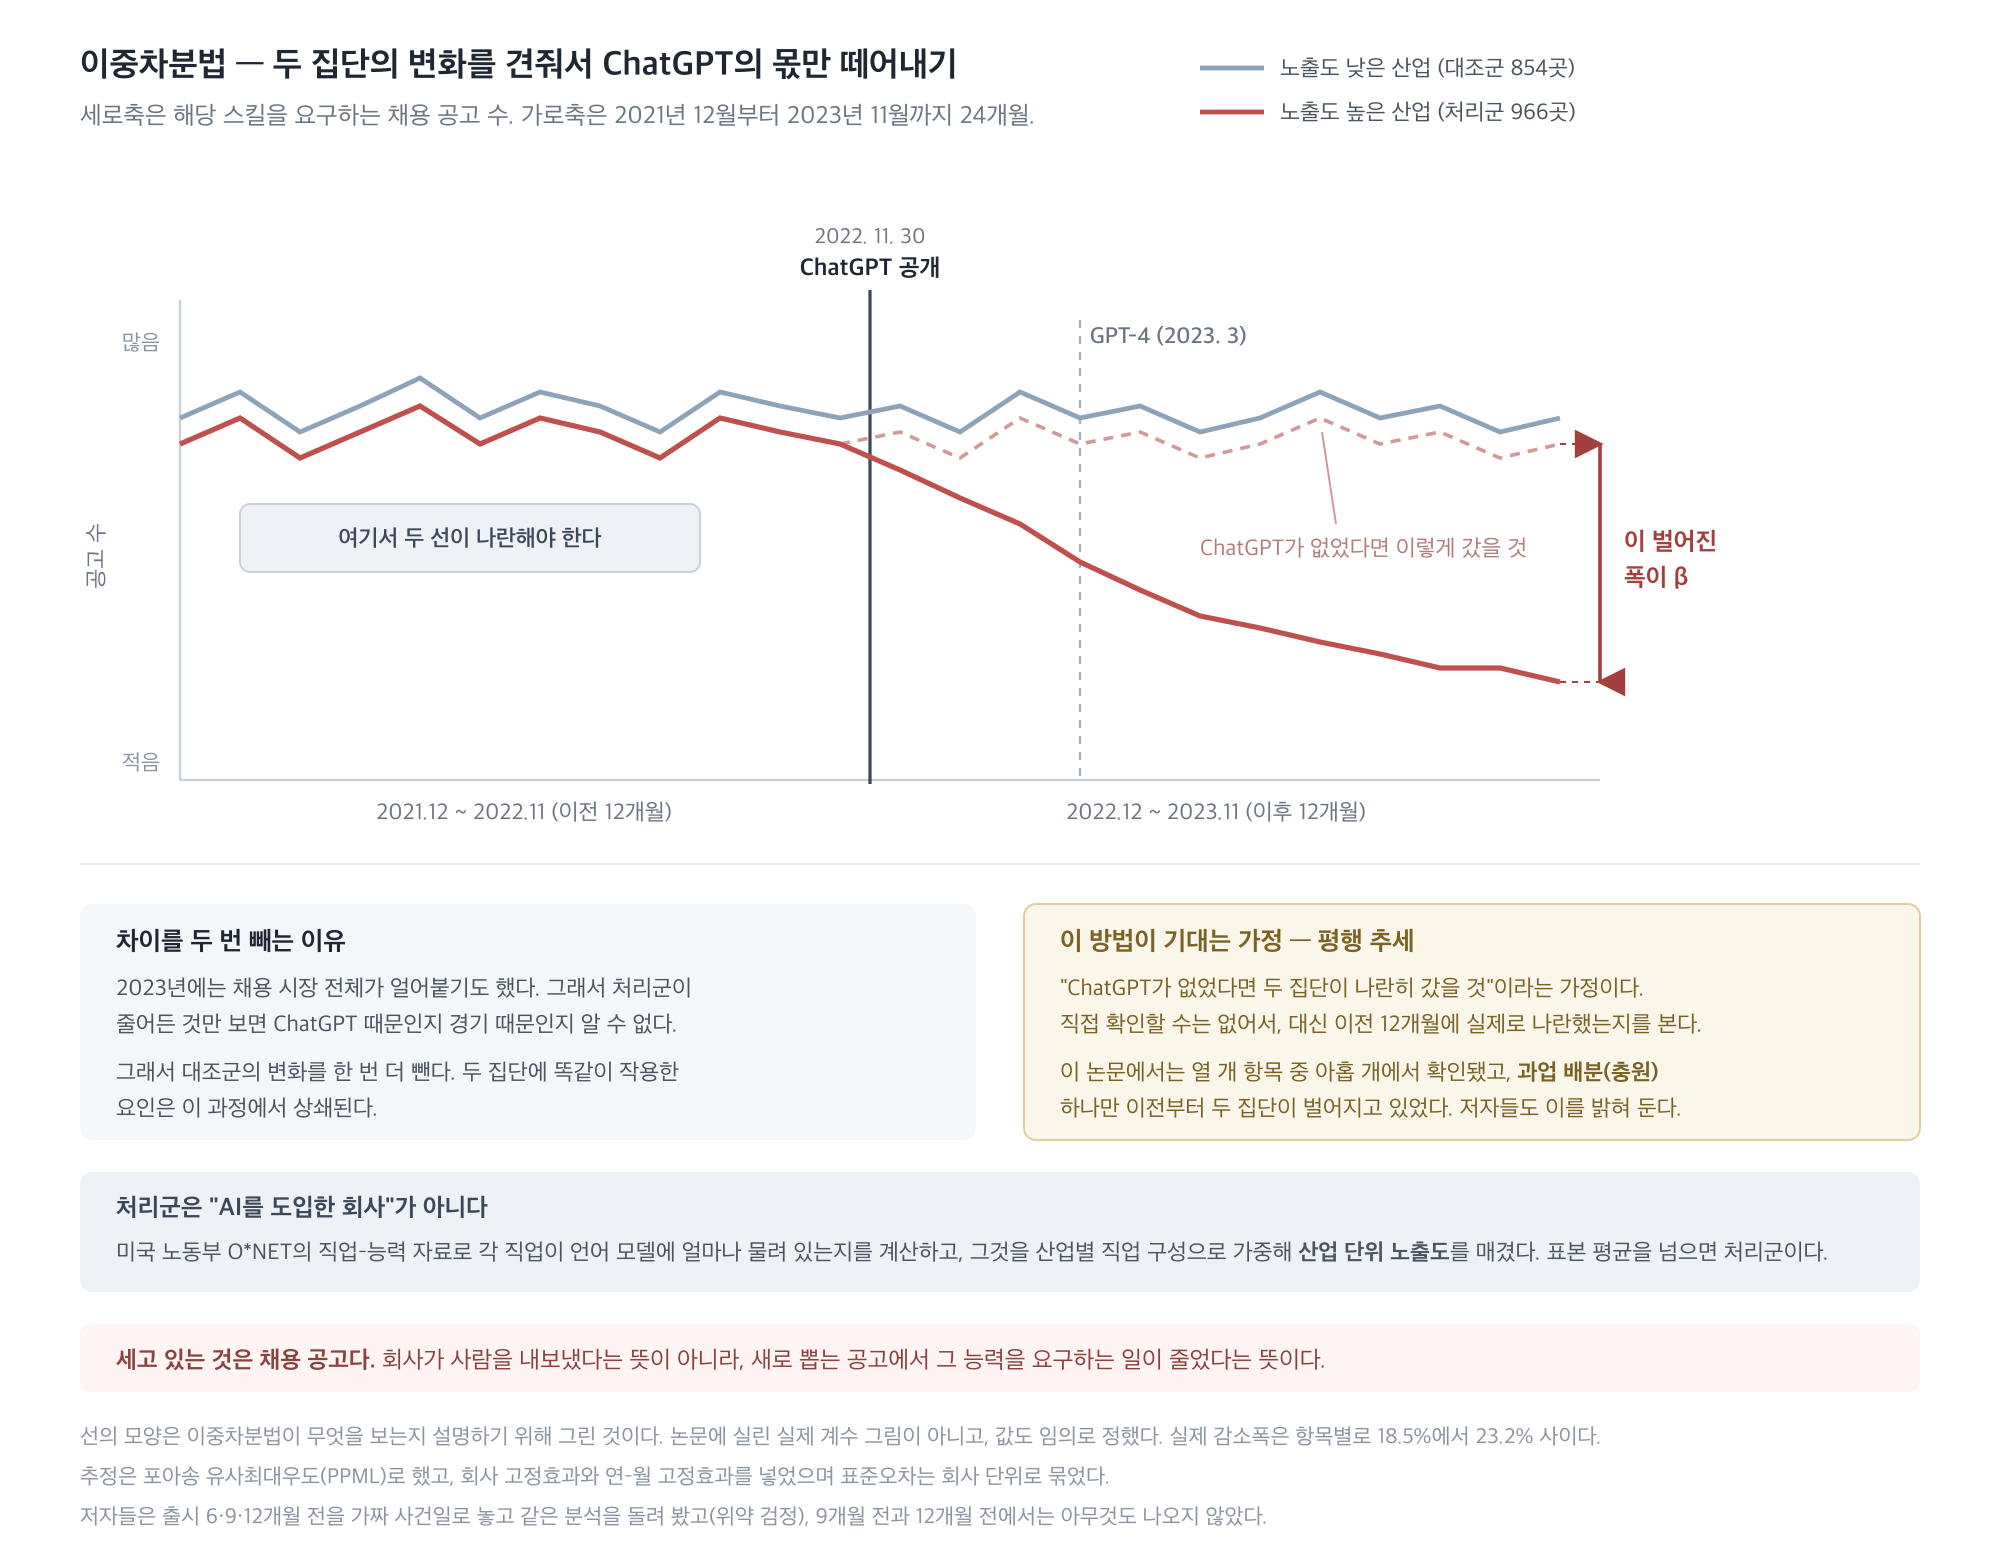
그림 2. 이중차분법을 이 논문에서는 어떻게 썼나 — 노출도 높은 산업과 낮은 산업의 공고 수를 24개월에 걸쳐 그린 것. ChatGPT 이전에는 두 선이 나란해야 하고, 이후에 벌어진 폭이 β다. 처리군은 “AI를 도입한 회사”가 아니라 직업 구성이 언어 모델에 많이 물린 산업의 회사를 말한다. 선의 모양은 방법을 설명하려고 그린 것이고 논문의 실제 계수 그림이 아니다.
✔️ 연구 결과
기업들은 원래 어떤 기술을 얼마나 찾고 있었나
먼저 기준선을 보자. 기업-월당 평균 공고 건수다.
| 항목 | 평균 공고 수 |
|---|---|
| 과업 분할 | 89.3 |
| 정보 제공 (동기) | 75.5 |
| 예외 관리 (운영) | 63.6 |
| 정보 제공 (비동기) | 60.1 |
| 정보 제공 (조정) | 52.9 |
| 보상 분배 (모니터링) | 24.6 |
| 예외 관리 (갈등) | 13.7 |
| 과업 배분 (매핑) | 13.0 |
| 과업 배분 (충원) | 5.1 |
| 보상 분배 (인센티브) | 1.4 |
과업 분할 관련 공고가 압도적으로 많고, 인센티브 설계 관련 공고는 거의 나오지 않는다. 표본 기업의 53%가 노출도 높은 산업으로 분류됐고, 평균 규모는 총자산 로그 7.87, 부채비율 0.30이며 42%가 R&D 지출을 보고했다.
1 기본 결과 — 무엇이 줄었나
아래 계수는 로그 눈금이라 그대로 읽으면 안 된다. exp(β) − 1이 실제 변화율이다.
| 항목 | 계수 | 변화율 | 유의성 |
|---|---|---|---|
| 과업 분할 | −0.261 | −23.0% | p<0.001 |
| 보상 분배 (모니터링) | −0.264 | −23.2% | p<0.001 |
| 정보 제공 (비동기) | −0.241 | −21.4% | p<0.01 |
| 정보 제공 (조정) | −0.240 | −21.3% | p<0.01 |
| 예외 관리 (운영) | −0.211 | −19.0% | p<0.01 |
| 정보 제공 (동기) | −0.204 | −18.5% | p<0.05 |
| 예외 관리 (갈등) | −0.224 | — | 유의하지 않음 |
| 보상 분배 (인센티브) | −0.150 | — | 유의하지 않음 |
| 과업 배분 (매핑) | −0.097 | — | 유의하지 않음 |
| 과업 배분 (충원) | +0.162 | — | 유의하지 않음 |
이론에서 예측한 세 가지가 모두 데이터로 확인됐다. 과업 분할, 정보 제공(조정·동기·비동기 세 하위 항목 모두), 모니터링이 줄었고, 과업 분할에 따라붙는다고 예측했던 운영 예외 관리도 함께 줄었다. 반대로 과업 배분(충원·매핑 모두), 인센티브, 갈등 조정에서는 유의한 변화가 없었다.
다만 갈등 조정은 조심스럽게 읽을 필요가 있다. 계수 자체(−0.224)는 유의하게 나온 다른 항목들과 비슷한 크기이지만, 표준오차가 0.131로 커서 유의성 문턱을 넘지 못했다. “변화가 없었다”라기보다 “변화가 있었는지 이 데이터로는 가려낼 수 없다”에 가까운 결과다. 통제변수를 넣어도 결과는 거의 그대로 유지된다.
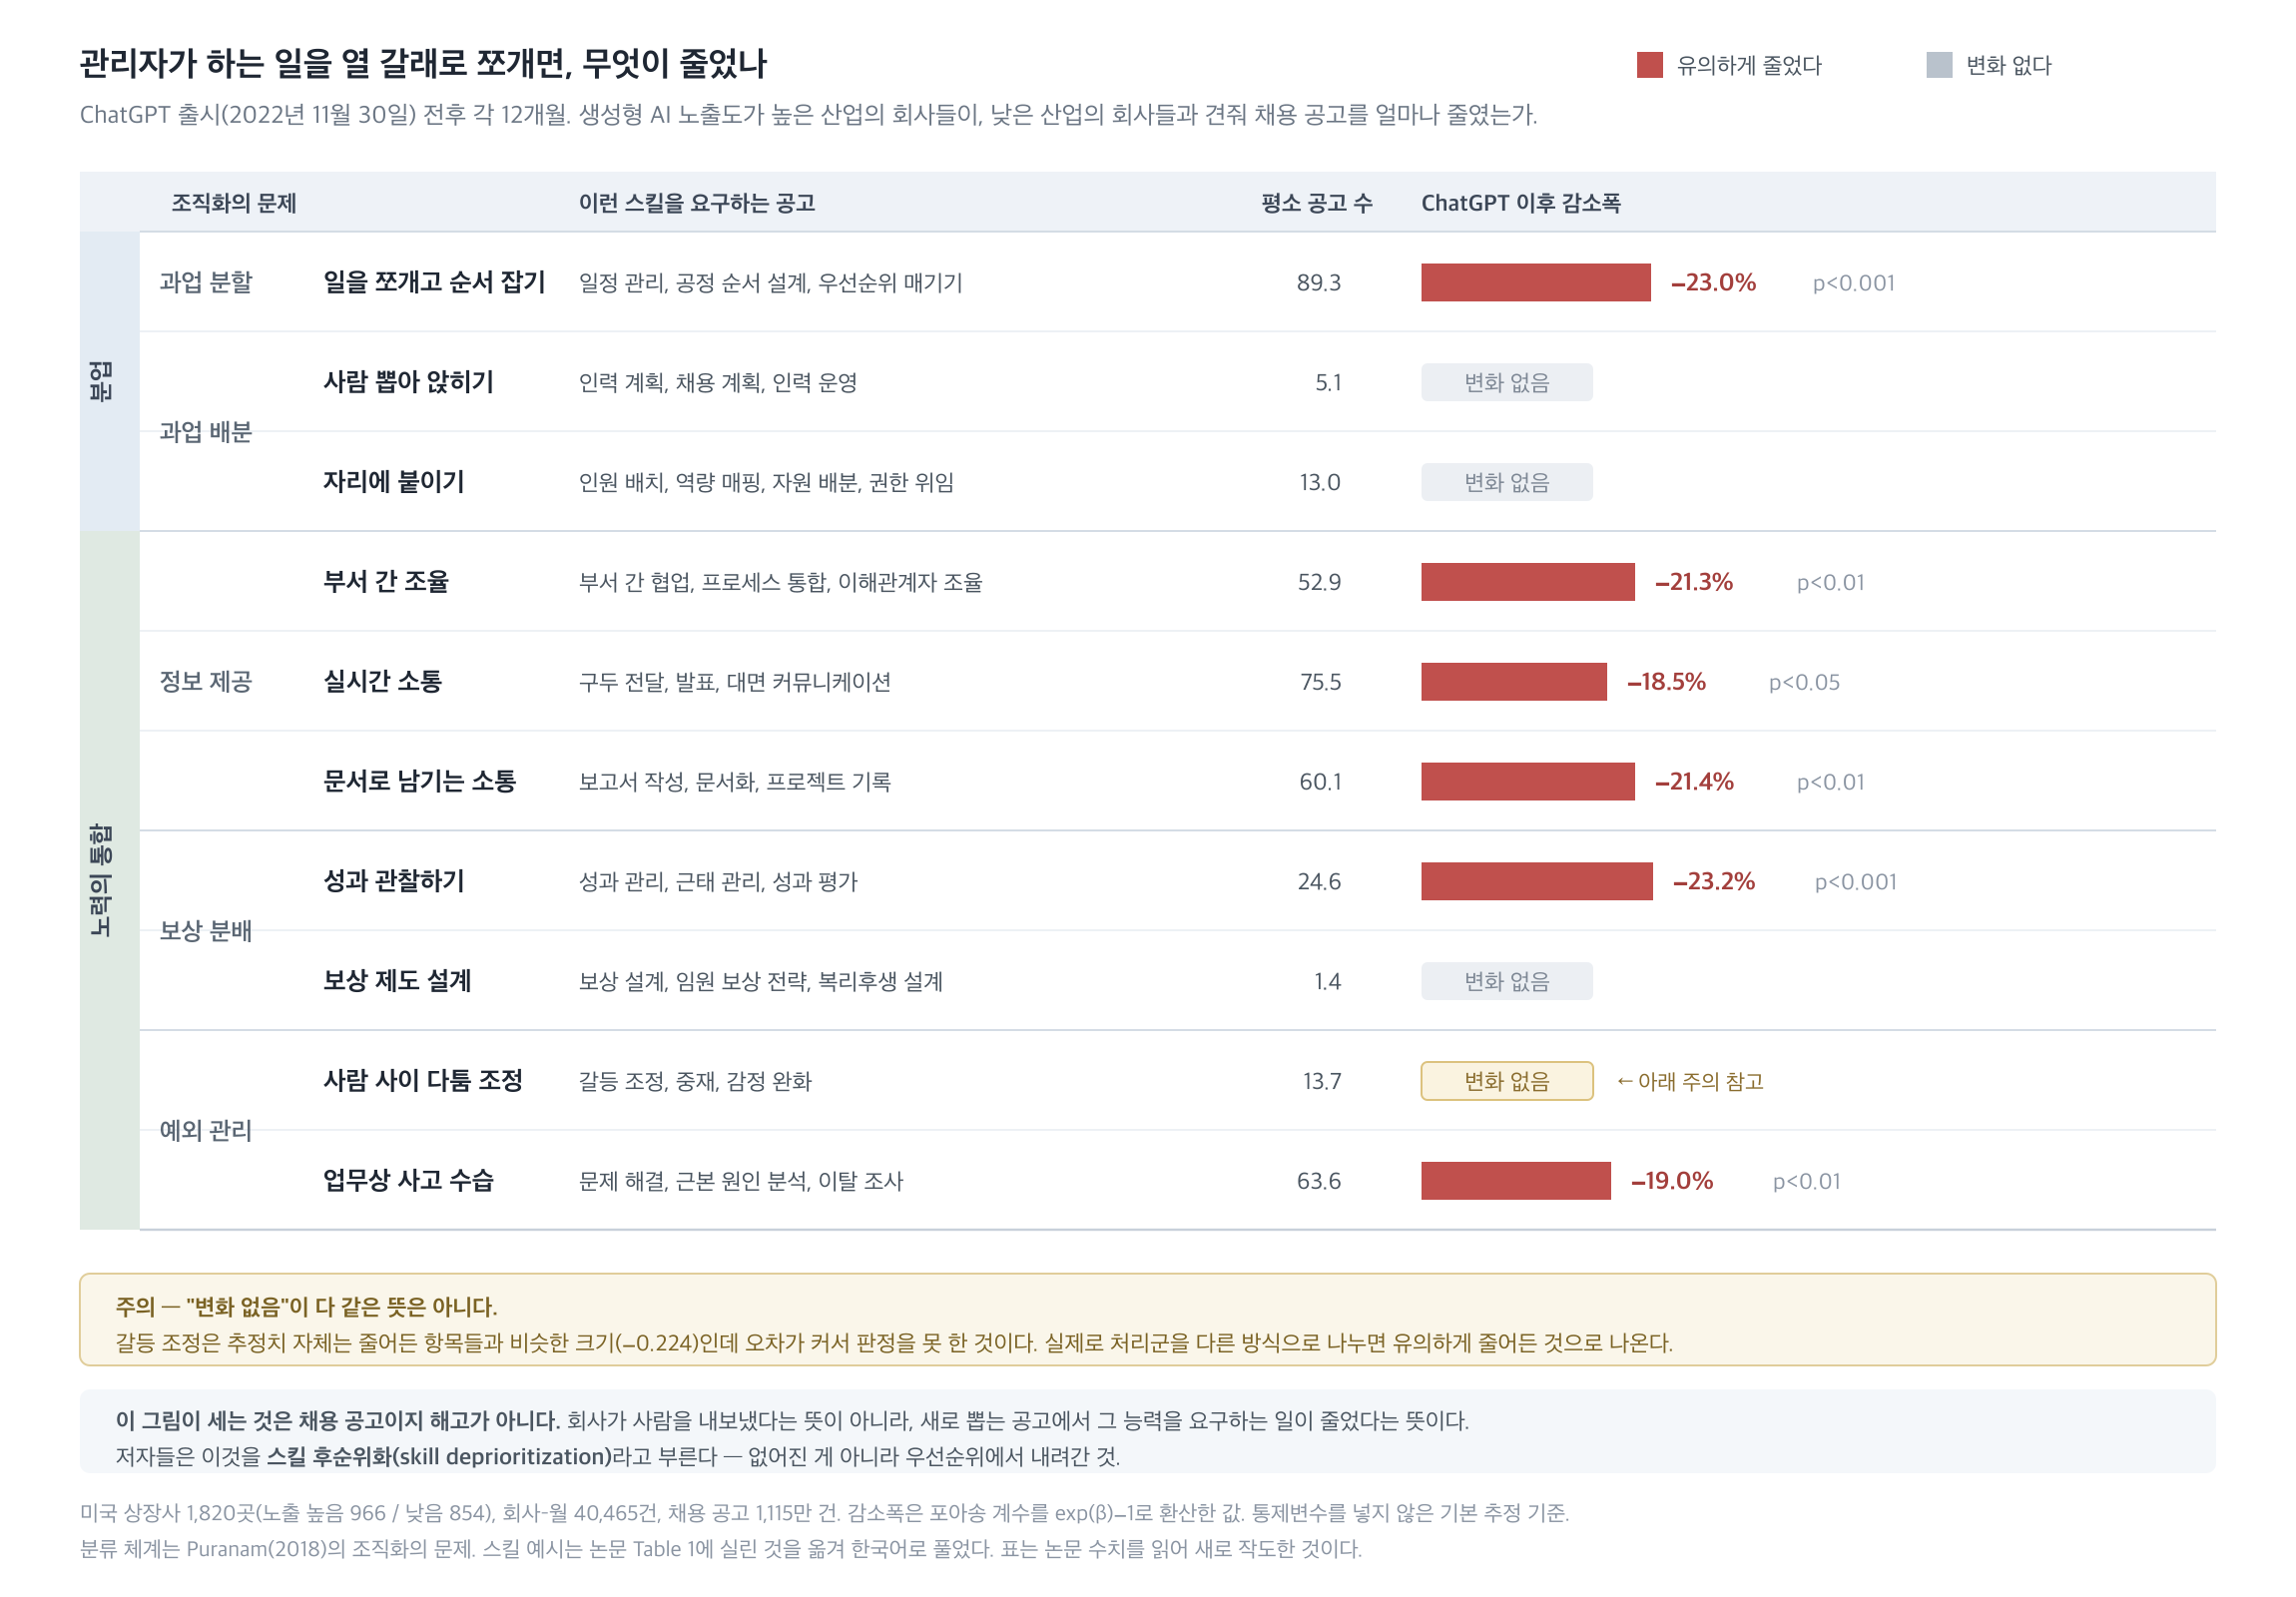
그림 3. 관리자가 하는 일을 열 갈래로 쪼개면, 무엇이 줄었나 — ChatGPT 출시 전후 각 12개월, 노출도가 높은 산업의 기업이 낮은 산업의 기업과 견줘 채용 공고(통제변수 미포함 기본 추정, exp(β)−1 기준)를 얼마나 줄였는지. 갈등 조정은 계수 크기는 비슷하지만 표준오차가 커 유의성 문턱을 넘지 못한 것으로, 문항 기준을 바꾸면 유의하게 줄어든다(「검증」 절 참고). 셋은 채용 공고가 줄어들지 않은 항목이다. 분류 기준은 Puranam(2018)의 틀을 따랐고, 표는 논문 Table 3을 새로 작도했다.
2 평행 추세는 성립했나
이중차분법은 “만약 ChatGPT가 없었다면 두 집단이 나란히 움직였을 것”이라는 가정 위에 있다. 저자들은 사후 시점을 월별 더미로 풀어 처리 이전 계수들이 모두 0인지 검정했고, 과업 배분(충원)을 제외한 대부분의 항목에서 이 가정은 기각되지 않았다. 충원은 처리 이전 기간부터 두 집단이 이미 다르게 움직이고 있어, 앞서 “충원은 변화가 없었다”고 한 결과는 다른 항목들보다 근거가 약하다.
3 노출도를 연속형으로, GPT-3.5와 GPT-4를 나눠서 확인하면
처리군/대조군 이분법 대신 산업별 노출도 값을 연속형으로 곱해 추정해도 결과는 대체로 같은 방향을 유지했다. 다만 정보 제공(동기, 실시간 소통) 항목만 유의성을 잃었는데, 이는 이 하위 항목이 뒤에 나오는 여러 견고성 검증에서도 반복해서 흔들린다는 신호다.
처리 시점을 GPT-3.5 기간(2022년 12월~2023년 2월)과 GPT-4 기간(2023년 3월 이후)으로 나누면 더 흥미로운 패턴이 나온다.
| 항목 | GPT-3.5 기간 | GPT-4 기간 |
|---|---|---|
| 보상 분배 (모니터링) | −0.164 (유의하지 않음) | −0.291 (p<0.001) |
| 예외 관리 (운영) | −0.150 (유의하지 않음) | −0.230 (p<0.01) |
| 정보 제공 (비동기) | −0.220 (p<0.05) | −0.250 (p<0.01) |
| 과업 분할 | −0.262 (p<0.01) | −0.260 (p<0.001) |
| 정보 제공 (조정) | −0.272 (p<0.05) | −0.225 (p<0.01) |
모니터링과 운영 예외 관리는 GPT-3.5 때는 유의하지 않다가 GPT-4 때 뚜렷하게 강해진다. 이는 화제성이나 신기함이 아니라 실제 AI 성능 향상이 기업의 채용 행태를 움직였다는 뜻으로 해석된다.
4 위약 검정과 반증 검정
가짜 시점(실제 출시일 6·9·12개월 전)에 같은 분석을 반복하는 위약 검정에서는 9개월·12개월 전 유의한 결과가 나오지 않았고, 6개월 전에도 크기가 작고 유의 수준이 낮은 계수 하나만 나왔다. 개발자 위주로 쓰임새가 좁은 GitHub Copilot 출시를 같은 방식으로 분석했을 때는 예상대로 뚜렷한 효과가 없었다. 언어 모델에 국한하지 않는 더 넓은 AI 노출도 측정치로 바꿔도 과업 분할·모니터링·운영 예외에서는 비슷한 결과가 나왔지만, 이 경우 과업 배분(매핑)에서 새로운 유의한 효과가 나타나 후속 연구 과제로 남겨졌다. 이 세 가지 검정 모두 원래 결과가 우연이 아님을 뒷받침한다.
5 추정 방법과 분류, 표본을 바꿔 가며
평행 추세 가정의 위반 정도에 대한 민감도 분석, 다른 추정량(ETWFE) 사용, 키워드 기반 재분류, 기술 기업 제외, 처리군 재정의(비정형 인지 직업 기준), 유사 기업 매칭(CEM) 등 다양한 방식으로 결과를 재확인했다. 어느 검증에서도 유의성이 유지된 항목은 과업 분할, 정보 제공(비동기), 모니터링, 운영 예외 관리 넷으로, 이 논문에서 가장 견고한 결과로 꼽힌다. 반대로 정보 제공(동기)과 모니터링 일부는 검증에 따라 유의성이 흔들렸고, 갈등 조정은 처리군을 어떻게 정의하느냐에 따라 결론이 달라졌다.
한 가지 눈여겨볼 결과는, 열 개 하위 항목을 다섯 개 대분류로 합치면 보상 분배와 예외 관리 안쪽의 차이(모니터링은 줄고 인센티브는 줄지 않은 것 등)가 지워진다는 점이다. 이 논문이 열 개로 세분화한 이유가 여기서 드러난다.
6 보조 분석 — 그냥 채용을 줄인 것은 아닌가
전체 채용 수요를 통제하고 재추정해도 조정과 과업 분할의 감소는 그대로 남아, 이 기술들이 전반적인 채용 감소와는 별개로 상대적으로 더 밀려났음을 보여준다. 관리직 공고를 비관리직 공고와 비교하면 노출도가 높은 기업일수록 관리직 비중이 더 줄었는데, 이는 앞서 설명한 통제 범위 논리와 방향이 맞는다. 동시에 생성형 AI 관련 기술을 요구하는 공고가 노출도 높은 기업들을 중심으로 가파르게 늘었다는 사실은, 처리군과 대조군을 제대로 갈랐다는 방증이기도 하다.
✔️ 결론
ChatGPT가 나온 뒤 1년 동안 미국 상장기업 중 노출도가 높은 산업의 기업들은, 노출도가 낮은 산업의 기업들과 비교했을 때, 업무를 세분화·정리하는 능력(−23%), 정보를 전달하는 능력(−18~21%), 성과를 관찰하는 능력(−23%), 운영상의 문제를 수습하는 능력(−19%)을 요구하는 공고를 줄였다. 반면 사람을 뽑아 자리에 앉히는 능력, 보상 제도를 설계하는 능력, 갈등을 조정하는 역할을 요구하는 공고는 통계적으로 의미 있게 변하지 않았다.
이 결과의 의의는, 이 예측이 데이터를 보기 전에 이미 세워져 있었다는 점이다. 저자들은 조직을 대기행렬로 놓고 “AI가 처리 시간의 변동성을 줄이는 업무부터 인력 수요가 줄어든다”는 예측을 먼저 세운 뒤 데이터를 확인했고, 실제 결과가 그 예측과 방향이 일치했다. 기업이 완전히 최적으로 움직인다고까지 주장하지는 않지만, 대기행렬 모형이 초기 반응을 설명하는 첫 근사치로는 유용하다는 것이 이 논문이 보여준 바다.
저자들이 밝힌 한계는 첫째, 처리군이 개별 기업이 아니라 산업 단위로 정해졌다는 점이다. 같은 산업 안에도 AI 도입 속도가 서로 다른 기업이 섞여 있는데, 이 차이가 반영되지 않았다. 대조군에 실질적으로 AI를 쓰는 기업이 섞여 있을수록 처리군과 대조군의 차이가 줄어들기 때문에 오히려 실제 효과보다 추정치가 작게 나왔을 가능성이 있다. 둘째, 관찰 기간이 ChatGPT 출시 후 12개월에 불과해, 기업이 조직 구조 자체를 실제로 다시 짜는 단계까지는 관찰하지 못했다는 점이다. 지금 확인한 것은 채용 공고에 나타난 1차 반응이며, 조직 구조 자체가 바뀌는 2차 효과는 앞으로 몇 년에 걸쳐 나타날 것으로 예상된다.
그럼에도 이 논문은 다음의 의의를 지닌다. 지금까지 “AI가 일자리를 없앤다”는 말은 대체로 직업 이름 단위로 오갔다. 이 논문은 그 눈금을 한 단계 낮춰, 직업 안의 관리 업무의 종류로 바꿨다. 이는 커리어를 준비하는 입장에서 “무슨 직무를 고를까”보다 “그 직무 안에서 어떤 종류의 판단을 맡을까”가 더 중요한 질문이 될 수 있다는 뜻이기도 하다. 이 논문이 다음 단계, 즉 2차 효과를 같은 방법으로 기업 단위에서 다시 측정할 수 있는 기준선을 마련한 것이다.
✔️ 참고 자료
- 대기행렬 이론(Queuing theory) — 줄을 서서 기다리는 문제를 다루는 산업공학 도구로, 이 논문 이론의 뼈대다. 위키백과에서 보기.
- 이중차분법(Difference-in-differences) — 이 논문의 주요 추정 방법이다. 위키백과에서 보기.
- O*NET — 미국 노동부의 직업-능력 데이터베이스로, 노출도 측정의 출발점이다. O*NET 바로가기.
- AI 직업 노출도(AIOE) — Felten, Raj, & Seamans (2021), Strategic Management Journal에 실린, 이 논문이 쓰는 AIOE 지표의 원 논문이다. 논문 보기.
- 잠재 디리클레 할당(LDA) — 기술 후보를 추려내는 데 쓰인 토픽 모델이다. 위키백과에서 보기.
- 코헨의 카파(Cohen’s kappa) — 두 사람의 분류가 얼마나 일치하는지 나타내는 지표다. 위키백과에서 보기.
- Lightcast — 이 논문의 데이터셋을 구축한 채용 공고 데이터베이스다. Lightcast 바로가기.
- 과업 분할 사례: Atlassian — Jira의 생성형 AI 기능은 평문으로 적은 목표를 하위 과업과 의존관계로 자동으로 쪼갠다. 제품 페이지 보기.
- 운영 예외 처리 사례: Stripe — Stripe는 내부적으로 GPT-4를 활용해 문서와 코드를 검토하고 오류 패턴을 찾아냈다. TechCircle 기사 보기(2023년 3월 16일).
- 정보 제공 사례: 미국 국무부 — 국무부는 2024년 직원 1,000명을 대상으로 내부 생성형 AI 챗봇을 도입해 정책 문서 요약과 번역에 활용했다. FedScoop 기사 보기.
- 모니터링 사례: Culture Amp — 이 HR 분석 도구는 ChatGPT를 활용해 슬랙 칭찬, 고객 코멘트, 동료 피드백을 성과 요약으로 정리했다. SHRM 기사 보기.