Why Algorithmic Advice Gets Inflated 알고리즘의 조언은 왜 과장되는가
What Hotel Pricing Data Reveals about the Human–Algorithm Conflict Over Adjustment Costs호텔 가격 데이터로 본, 조정비용이 만들어 내는 인간-알고리즘 간 이해충돌
Garcia et al. (2026) · Management ScienceGarcia et al. (2026) · Management Science
Garcia, D., Tolvanen, J., & Wagner, A. K. (2026). Strategic Responses to Algorithmic Recommendations: Evidence from Hotel Pricing. Management Science, 72(1), 609–626.
✔️ Introduction and Summary
As algorithms take on a larger role in decision-making, “human in the loop” has become the standard safeguard: the idea that a final human check can catch an algorithm’s errors. But that safeguard only works if the human actually intervenes.
The record from the U.S. Department of Justice’s antitrust suit against the rental-pricing software RealPage shows how easily that premise can break down. According to DOJ filings, a recommended rent could be accepted for an entire portfolio with a single keystroke, or even set to accept automatically, while deviating from a recommendation required the property manager to justify the decision, and if the company wasn’t satisfied with the justification, the case was escalated to a supervisor. The result: more than 85% of final rents landed within 5% of the recommended price. The legal issue in that case was collusion, a different question from the one this paper takes up, but the two share a common thread: when accepting is easy and deviating is effortful, a human’s decision-making authority can end up merely nominal.
This paper argues that this kind of structure changes the content of the advice itself. If an algorithm knows that the person receiving its advice rarely acts on it, then inflating the advice in advance is, from the algorithm’s own perspective, the rational response. Until now, distortion in algorithmic advice has mainly been explained by bias baked into training data, or by “algorithm aversion,” people’s tendency to distrust and ignore algorithmic advice (Dietvorst et al., 2015). This paper offers a third, distinct explanation. Even with unbiased data and fully aligned goals between the two sides, advice can still be systematically distorted by one thing alone: a difference in how costly it is for each side to change a decision.
✔️ Research Content and Logic
The Conflict of Interest Created by Asymmetric Adjustment Costs
The model economists typically reach for to explain distorted advice is cheap talk: a framework for situations where non-binding messages are exchanged, and where distortion is usually attributed to a divergence in what the two sides prefer (Crawford & Sobel, 1982). This paper’s setup is different. The revenue-management firm that operates the algorithm treats its clients’ revenue gains as a sales asset, so a hotel’s revenue growth is directly in the firm’s own interest. Even with preferences fully aligned, a conflict of interest still arises from a single source: the cost of changing a price. Updating a price costs the algorithm nothing, so whenever the optimal price shifts even slightly, it is in the algorithm’s interest to reflect that change immediately. For the manager, by contrast, updating a price demands time and attention to review the screen and make a judgment call. This cost of the act of changing a price is called the “price-adjustment cost,” and unlike for the algorithm, it is far from trivial for a human. As a result, unless the suggested change is large enough, it is rational for a manager to simply leave the price where it is.
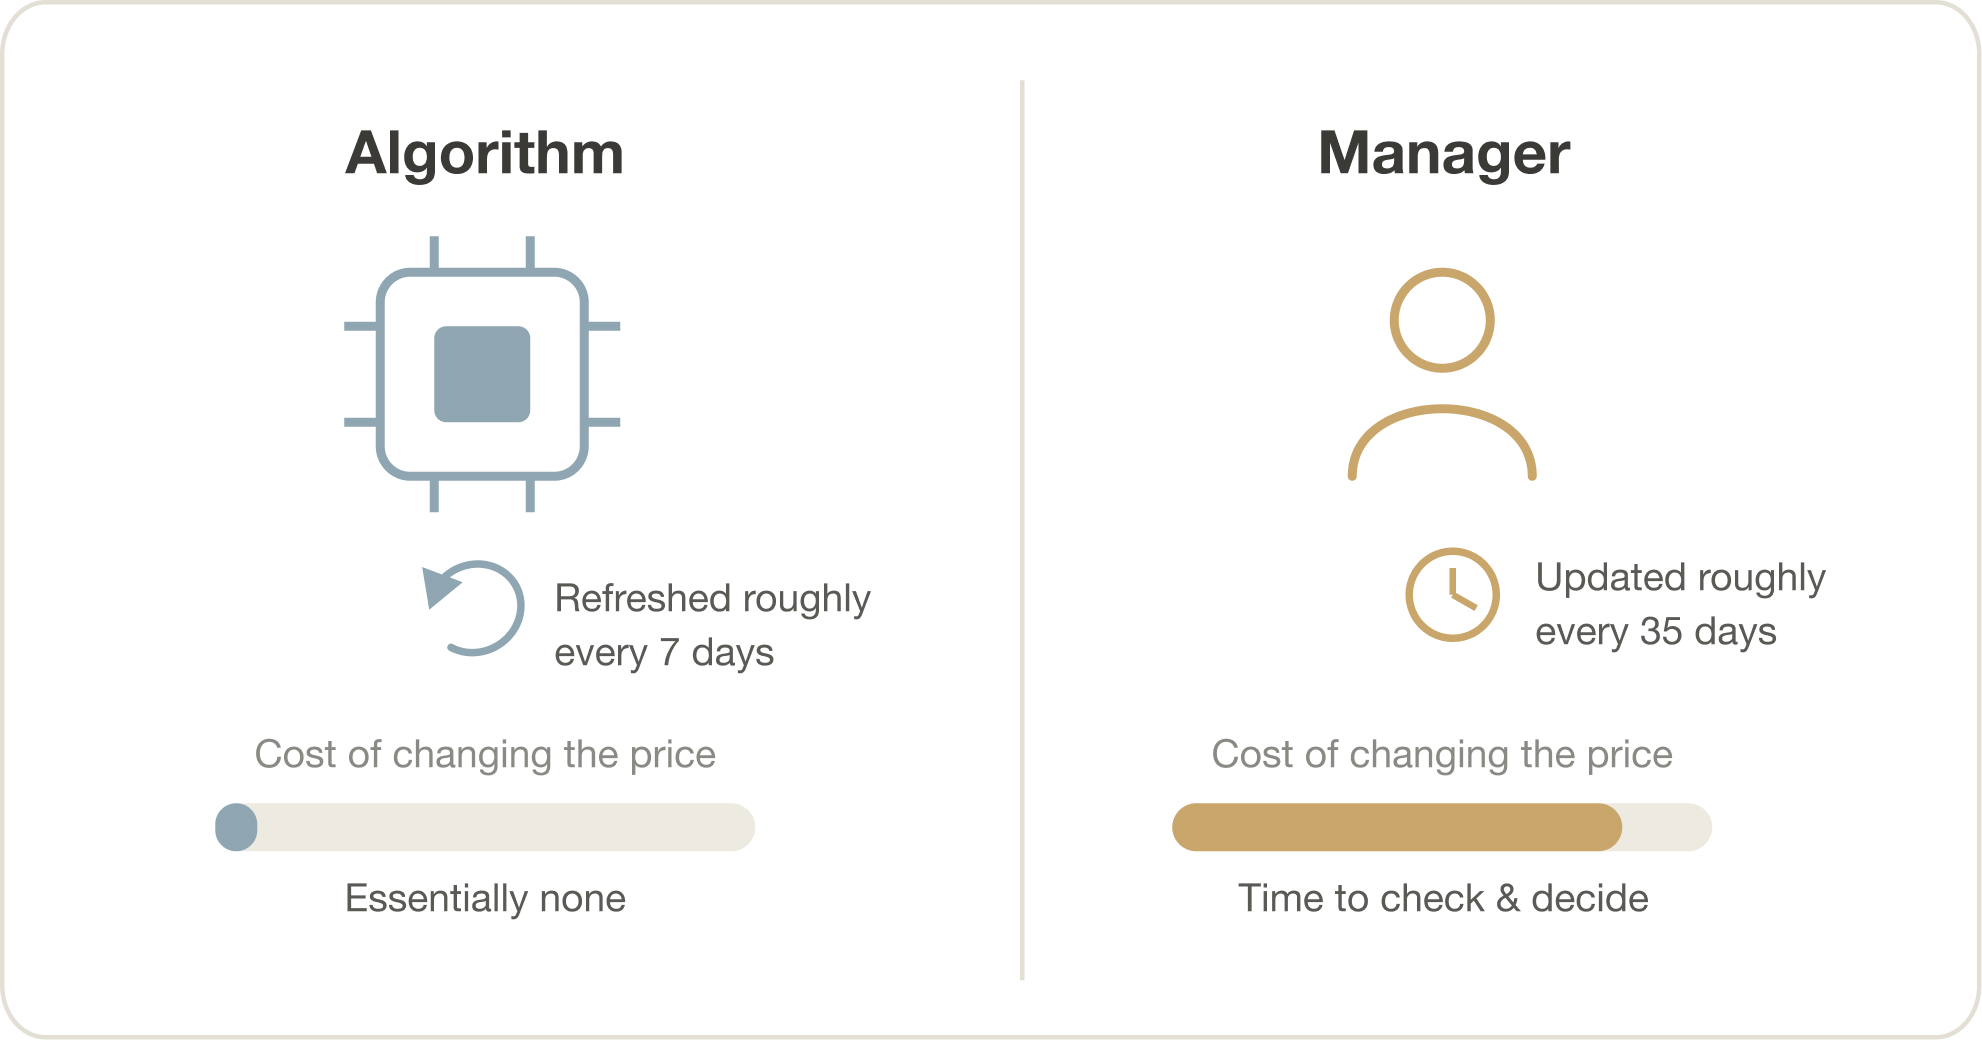
Figure 1. The difference in adjustment costs borne by the algorithm and the manager. Updating a price costs the algorithm essentially nothing, but for the manager it takes time and attention to check the screen and make a judgment call: an adjustment cost. This asymmetry shows up in how often each side actually updates (every 7 days versus every 35 days).
The only lever the algorithm has to close this gap is the number it reports. Reporting a change as larger than it is raises the odds that the manager will act and adjust the price. But this comes at a cost: if the manager takes an inflated recommendation at face value, the price that actually gets set drifts further from optimal, and both the algorithm and the manager share that loss. How much the algorithm chooses to inflate its recommendation, then, is set at the point where two forces balance: inflating more raises the chance the manager updates the price, but it also raises the error that results if the manager copies the recommendation outright. The degree of exaggeration at this equilibrium is what the paper calls the bias factor.
The Manager’s Response and a Two-Stage Cost Structure
Because the manager knows the algorithm inflates its advice, they don’t take the recommended change at face value when entering a price manually. The pass-through rate observed in the data (the share of a recommended price change that carries over into the actual price) is 0.725. The authors caution against reading this number directly as the size of the bias. Cases where the manager enters a price manually, rather than copying the recommendation, tend to occur precisely when the manager’s own read of local conditions points in the opposite direction from the recommendation. If bookings look soft and the manager believes the price should come down while the algorithm is recommending an increase, the manager will ignore the recommendation and lower the price based on their own judgment. As a result, the set of manual-entry cases is systematically loaded with instances where the manager’s information runs counter to the recommendation, which pulls the observed pass-through rate below the true degree of bias. This pattern, where the very sample observed under certain conditions fails to represent the whole, is called negative selection. Left uncorrected, this distortion implies the recommendation is inflated by a factor of 1.39; once the model described below corrects for it, the estimate comes down to the roughly 1.2 mentioned earlier.
There is one feature of manager behavior that a conventional advice model like cheap talk cannot explain. In models like cheap talk, the more extreme the advice (the larger the suggested change), the less likely the recipient is to act on it, since an unusually large ask naturally reads as less credible. The hotel data analyzed in this paper shows the opposite pattern: the larger the swing in the recommendation, the more likely the manager is to copy it outright. The authors explain this with a two-stage cost structure.
| Stage | Manager’s Choice | Cost | Outcome |
|---|---|---|---|
| Stage 0 | Do not engage | None | Keep the existing price |
| Stage 1 | Give the price screen attention | Attention cost | Access readily available local information |
| Stage 2 | Work out the optimal price directly | Thinking cost | Gather additional information and set the price freely |
A large swing signals that the matter is important, so the manager only pays attention in cases like that. But paying attention doesn’t mean the manager can work out the optimal price on their own; that requires a separate thinking cost. This is why most managers stop at Stage 1 and accept the recommendation. The actual price-setting interface matches this cost structure: accepting a recommendation takes a single click, while entering a price manually means switching to a different screen and filling in the values one at a time.
✔️ Data and Methodology
The data came from an anonymous, Europe-based revenue-management service provider. Records from nine of the firm’s hotel clients were used in the analysis: eight resort properties and one urban property. Each hotel was observed for roughly 14 months, yielding about 6 million daily price records and roughly 60,000 bookings. The unit of observation is a room type paired with an arrival date, meaning a specific product such as a given room sold for a given date.
The hotels in the sample have around 50 rooms each and are family-run operations where managers wear multiple hats, with no staff dedicated solely to pricing. This background likely contributes to the large adjustment costs observed in the paper, and results could differ at a large chain with a dedicated pricing team.
One restriction was applied to the sample. The main sample used in the analysis is limited to observations where the prior price matched the recommended price (N = 2,017,932, about 34% of the total). Restricting the sample this way allows any gap between the recommendation and the actual price to be interpreted as arising from information processing at that specific point in time. It also rules out a feedback effect, where a manager’s past manual entries loop back to shape the algorithm’s future recommendations. Price changes were measured as ratios by converting each day’s price to a log value and comparing it to the prior day; a price update was defined as any day this value changed.
Four Facts Observed in the Data
Before presenting the model, the paper first lays out the following regularities found in the data.
Managers update prices far less often than the algorithm updates its recommendations. The algorithm changes its recommendation on average every 7 days, while the manager changes the actual price on average once every 35 days. The larger the swing in the recommendation, the more likely the manager is to actually update the price: the update probability is just 0.6% when the recommendation doesn’t change at all, but rises to 14.3% when the recommendation shifts by more than 10%. The same logic applies to copying: the larger the swing, the more likely the manager copies the recommendation outright, with the copy rate rising from an overall average of 84.0% to 95.0% when the change exceeds 10%. Conversely, when the manager enters a price manually rather than copying the recommendation, the change in the recommendation isn’t fully reflected in the actual price: the pass-through rate is only 72.5%, and stays around 73% even after controlling for other factors.
The relationships between swing size and update probability, and between swing size and copy probability, hold up even when comparing only observations within the same hotel, the same booking horizon, and the same arrival month, meaning they aren’t a coincidental correlation driven by seasonality or hotel-specific characteristics.
Model and Estimation Method
In the paper’s model, the loss a manager incurs is proportional to the gap between the actual price and the optimal price. The optimal price, in turn, is made up of three kinds of information: private information held only by the algorithm, local information the manager can access immediately by paying the attention cost, and information that requires additionally paying the thinking cost to obtain. The manager cannot observe the algorithm’s private information directly and can only infer it indirectly through the recommended price. But as established above, the algorithm doesn’t pass this information along as-is; it inflates it by some fixed factor. The paper’s notion of “equilibrium” refers to the state where the degree to which the algorithm actually inflates its advice exactly matches the degree of exaggeration the manager expects. This equilibrium assumes the manager knows precisely how much to discount the recommendation.
Applying this model to the actual data required estimating several values: the degree of exaggeration, the share each of the three information types contributes to the optimal price, and values capturing how much decision-making costs vary from case to case. These were estimated using the Method of Simulated Moments (SMM), which repeatedly simulates the model on a computer and adjusts these values until the simulated results converge as closely as possible on the values actually observed in the data. Seven moments were used as the basis for comparison: the relationship between price and the dispersion of the recommendation at the time of an update, the rate at which the recommendation is copied outright, the average update rate, and others. The estimation process also imposes the condition that the estimated degree of exaggeration must actually be optimal for the algorithm; repeating the estimation until a value satisfying this condition is found confirms that the observed exaggeration isn’t incidental but a deliberate choice by the algorithm.
✔️ Findings
The Size of the Recommendation Bias
Pooling across all hotels, the estimated bias factor came out to 0.83, meaning the algorithm’s recommendation is inflated by roughly 1.2 times the actual optimal price change, a bias that is statistically distinguishable from zero. Broken down by hotel, this value ranges widely from 0.60 to 0.93, and this spread traces back to how much information the algorithm holds about a given hotel and to how strong the manager’s inertia, or reluctance to change prices, happens to be. The more inert a manager, the more the algorithm tends to inflate its recommendation.
The Distribution of Information
The algorithm’s private information explains only 20–30% of the total variation in the optimal price. The rest is local information only the manager can access, and by value alone, what the manager holds is more than five times larger than what the algorithm holds. The catch is that checking and acting on that information costs the manager attention and thinking effort. As a result, the standard deviation of the actual price ends up smaller than the standard deviation of the gap between the optimal price and the actual price, meaning a large share of the swings in the optimal price never make it into the actual price at all.
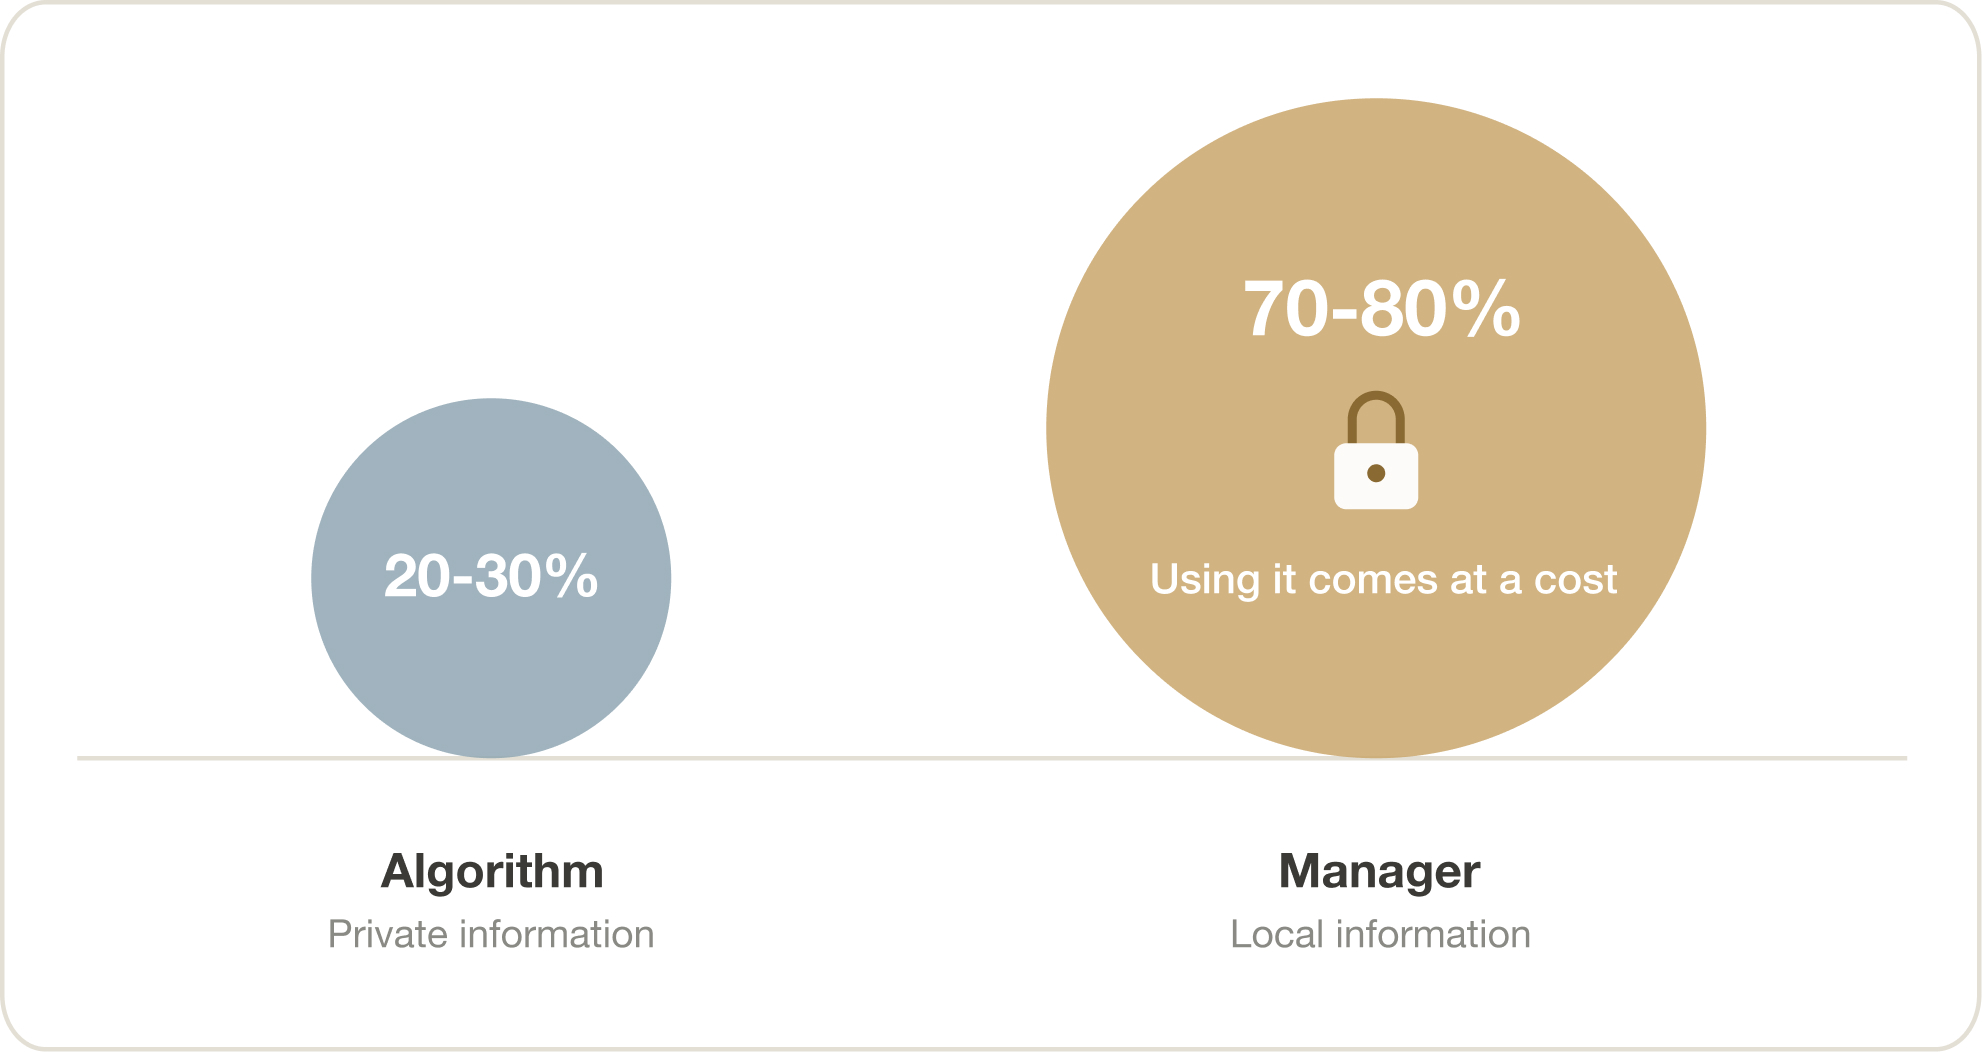
Figure 2. The share of information held by the algorithm versus the manager. Of the information explaining variation in the optimal price, the algorithm’s private information accounts for only 20–30%; the rest is local information only the manager can access. But acting on that information comes at a cost.
The Effect of Delegation
The estimated model is also used to calculate the size of the loss under several counterfactual scenarios. The benchmark is a fully passive manager who never changes the price at all, with that scenario’s loss normalized to 1 and every other scenario’s loss expressed relative to it; smaller values mean a more efficient outcome. Full delegation refers to handing pricing authority entirely to the algorithm, which also eliminates the adjustment cost the manager would otherwise bear.
| Scenario | Description | Loss (range across 9 hotels) |
|---|---|---|
| Status quo | The current setup, where the manager reviews the recommendation before setting the price. Calculated including the adjustment cost. |
0.984 – 0.998 |
| Status quo (excluding adjustment cost) |
Same setup, but excluding the adjustment cost the manager incurs from checking the screen and making a judgment call. |
0.967 – 0.991 |
| Full delegation | Pricing authority is handed entirely to the algorithm, which sets the exact price with no exaggeration. |
0.643 – 0.961 |
| Delegation with bias retained |
Pricing authority is handed to the algorithm, but the algorithm keeps inflating its recommendations as before. |
0.673 – 0.961 |
| No recommendation | The manager receives no algorithmic recommendation at all and sets prices entirely on their own. | 0.996 – 1.000 |
The status quo improves on full passivity by only 1–3%, and that margin shrinks further once the adjustment cost is factored in. Full delegation, by contrast, cuts the loss by 4–36%. What stands out is how small the gap is between the third and fourth rows of the table: even when the algorithm keeps its exaggeration intact after taking over pricing, the outcome is barely different from full delegation without bias. This suggests the bias itself isn’t the main source of the loss. Breaking down where the gains from delegation actually come from: roughly 80% comes from adjusting prices more frequently, about 10% from removing the bias, and the remaining 10% from eliminating the cost of processing information. The fifth row points in the same direction: the loss under no recommendation being nearly identical to full passivity shows just how rarely managers adjust prices on their own initiative.
✔️ Conclusion
What this research demonstrates is a single chain running through three links. Because changing a decision costs something, people rarely intervene; because the algorithm takes that inertia as a given, it inflates its advice; and because people anticipate that exaggeration, they discount the advice before acting on it. What’s striking is that even though both sides predict each other’s behavior with precision, the price that actually results keeps drifting from optimal. What’s more striking still is that neither side is at fault in this distortion. The goals are aligned, the data carry no bias, and the manager isn’t behaving irrationally. And yet a single asymmetry, the adjustment cost, is enough on its own to produce this distortion, a condition that could recur anywhere an algorithm and a human work together.
One implication worth drawing out is that simply keeping a human in the loop is not, by itself, a safeguard. In this paper, the manager held information worth more than five times what the algorithm held, yet most of it went unused, which suggests that keeping human judgment meaningfully present in a system requires designing not the authority to decide, but the cost of deciding. Along the same lines, the paper confirms that merely having a default option available reshapes the incentives on the advice-giving side. Any environment where sticking with the status quo takes one click while deviating requires extra effort, such as a diagnostic-support system for physicians or a parole risk-assessment tool (Berk, 2017), could give rise to the same conflict of interest. Because this result comes from nine family-run hotels with around 50 rooms each, whether it carries over to a large chain with a dedicated pricing organization will likely depend on the size of the adjustment cost there.
The value of this paper extends well beyond the specific context of hotel pricing. A common assumption in designing systems where algorithms and humans work together has been that simply leaving the final decision with a human is enough to catch the algorithm’s errors. This research puts that assumption directly to the test. That a human holds decision-making authority and that this authority is actually exercised are two entirely different things, and as long as an adjustment cost exists, this paper shows with data that the authority remains nominal while the algorithm effectively makes the decision. Further, this result suggests that asking where a bias in algorithmic advice comes from may matter more than simply establishing that the bias exists. The right response differs depending on whether the distortion traces back to flawed data, to human distrust of the algorithm, or, as this paper identifies, to a gap in how costly it is for each side to change a decision. Showing that advice can be systematically distorted even when the data are flawless and the manager behaves rationally amounts to a warning for any structure that expects a human to serve as the algorithm’s watchdog. Simply occupying the seat where decisions get made guarantees nothing; creating the actual conditions for a person to intervene from that seat is itself part of the design task, and that is the conclusion this paper leaves us with.
📎 References
- Crawford, V. P., & Sobel, J. (1982). Strategic information transmission. Econometrica, 50(6), 1431–1451. doi.org/10.2307/1913390 — the cheap-talk model discussed in the Research Content section, cited as the standard framework this paper’s aligned-preferences setting contrasts with.
- Dietvorst, B. J., Simmons, J. P., & Massey, C. (2015). Algorithm aversion: People erroneously avoid algorithms after seeing them err. Journal of Experimental Psychology: General, 144(1), 114–126. doi.org/10.1037/xge0000033 — source of the “algorithm aversion” concept mentioned in the Introduction.
- Berk, R. (2017). An impact assessment of machine learning risk forecasts on parole board decisions and recidivism. Journal of Experimental Criminology, 13(2), 193–216. doi.org/10.1007/s11292-017-9286-2 — cited in the Conclusion as another domain where the same structure could recur.
- U.S. Department of Justice. (2024, August 23). Justice Department sues RealPage for algorithmic pricing scheme that harms millions of American renters [Press release]. justice.gov — source for the rent-pricing software example in the Introduction, on automatic acceptance and the process for checking compliance with recommendations.
- U.S. Department of Justice, Antitrust Division. (2025, May 14). United States et al. v. RealPage, Inc., et al.: Competitive impact statement. Federal Register, 90(92), 20505. govinfo.gov — same case, source for the asymmetry between the procedures required to accept versus deviate, and for the finding that over 85% of final rents landed within 5% of the recommended price.
Garcia, D., Tolvanen, J., & Wagner, A. K. (2026). Strategic Responses to Algorithmic Recommendations: Evidence from Hotel Pricing. Management Science, 72(1), 609–626.
✔️ 소개 및 요약
알고리즘이 의사결정에 개입하는 범위가 넓어지면서 최종 판단은 사람이 내려야 한다는 원칙(human in the loop)이 하나의 통제 장치로 자리 잡았다. 이 원칙은 사람이 알고리즘의 오류를 걸러 낼 수 있다는 전제에서 출발하는데, 그 전제가 성립하려면 사람이 실제로 판단에 개입해야 한다.
미국 법무부가 임대료 산정 소프트웨어 RealPage를 상대로 제기한 반독점 소송의 기록은 이 전제가 얼마나 쉽게 흔들릴 수 있는지를 말해 준다. 법무부 자료에 따르면 추천 가격은 키 입력 한 번으로 일괄 수락하거나 아예 자동 수락으로 설정할 수 있었던 반면, 추천에서 벗어나려면 담당자가 사유를 소명해야 했고 회사가 이를 수긍하지 않으면 상급자에게 보고가 올라갔다. 그 결과 최종 임대료의 85% 이상이 추천 가격의 5% 이내에서 결정되었다. 이 사건의 법적 쟁점은 담합이어서 소개될 논문의 주제와는 다르지만, 수락은 쉽고 이탈은 번거로운 구조에서 사람의 결정권이 명목에 그친다는 점만큼은 공통적이다.
논문은 이러한 구조가 조언의 내용 자체를 바꿔 놓는다고 주장한다. 조언을 받는 사람이 좀처럼 그 조언을 따르지 않는다는 사실을 알고리즘이 알고 있다면, 조언의 폭을 미리 부풀리는 편이 알고리즘 입장에서는 오히려 합리적인 대응이 되기 때문이다. 알고리즘 조언의 왜곡은 그동안 학습 데이터에 내재한 편향이나, 사람이 알고리즘을 불신하여 조언을 무시하는 경향인 ‘알고리즘 혐오(algorithm aversion)’로 설명되어 왔다(Dietvorst et al., 2015). 이 논문이 제시하는 것은 이 둘과 다른 세 번째 경로다. 데이터에 편향이 없고 양측의 목표가 완전히 일치하더라도 결정을 바꾸는 데 드는 비용이 서로 다르다는 사실 하나만으로 조언은 체계적으로 왜곡될 수 있다.
✔️ 연구 내용 및 논리
조정비용의 비대칭이 만드는 이해충돌
조언이 왜곡되는 이유를 설명할 때 경제학에서 흔히 쓰는 모형이 치프토크(cheap talk) 모델이다. 구속력 없는 메시지가 오가는 상황을 다루는 이론으로 양측이 선호하는 결과가 다르다는 데서 왜곡이 비롯된다고 보지만(Crawford & Sobel, 1982), 이 논문의 설정은 다르다. 수익관리 회사, 즉 이 알고리즘을 운영하는 쪽은 고객사의 매출 개선 실적을 영업 자산으로 활용하므로 호텔의 수익 증대가 곧 자신의 이익이다. 선호가 일치함에도 이해충돌이 생기는 지점은 가격을 바꾸는 데 드는 비용 하나뿐이다. 알고리즘에게 가격 갱신은 비용이 들지 않으므로, 최적 가격이 조금이라도 변하면 그때마다 이를 반영하는 편이 알고리즘 입장에서는 유리하다. 반면 관리자에게 가격을 갱신하는 일은 화면을 확인하고 판단을 내리는 시간과 주의를 요구한다. 이처럼 가격을 바꾸는 행위 자체에 드는 비용을 ‘가격 조정비용(price-adjustment cost)’이라 부르는데, 알고리즘과 달리 사람에게는 이 비용이 결코 작지 않다. 그래서 관리자 입장에서는 변화 폭이 충분히 크지 않다면 가격을 그대로 두는 편이 합리적이다.

그림 1. 알고리즘과 관리자가 치르는 조정비용의 차이. 알고리즘에게 가격 갱신은 비용이 들지 않지만, 관리자에게는 화면을 확인하고 판단하는 시간과 주의, 즉 조정비용이 든다. 이 비대칭이 관찰된 갱신 주기의 차이(7일 대 35일)로 이어진다.
이 격차를 좁히기 위해 알고리즘이 쓸 수 있는 수단은 추천 숫자뿐이다. 변화가 커 보이도록 보고하면 관리자가 가격을 조정할 확률이 높아지기 때문이다. 다만 여기에는 대가가 따른다. 관리자가 부풀려진 추천을 그대로 받아들이면 실현되는 가격이 최적에서 멀어지고, 그 손실은 알고리즘과 관리자 양쪽이 함께 떠안는다. 결국 알고리즘이 추천을 얼마나 부풀릴지는 두 힘이 맞서는 지점에서 정해진다. 많이 부풀릴수록 관리자가 가격을 조정할 확률은 높아지지만, 관리자가 그 추천을 그대로 따랐을 때 생기는 오차도 함께 커지기 때문이다. 이 균형점에서 정해지는 과장의 정도를 논문은 편향 계수(bias factor)라 부른다.
관리자의 대응과 두 단계 비용 구조
관리자는 알고리즘이 과장한다는 사실을 알고 있으므로, 직접 가격을 입력할 때는 추천의 변화 폭을 그대로 반영하지 않는다. 자료에서 관측된 전가율(pass-through rate, 추천 가격의 변화가 실제 가격 변화로 이전되는 비율)은 0.725다. 저자들은 이 수치를 편향의 크기로 곧바로 해석해서는 안 된다고 지적한다. 관리자가 추천을 복사하지 않고 직접 가격을 입력하는 경우는 대체로 자신이 파악한 현장 상황이 알고리즘의 추천과 반대 방향을 가리킬 때 발생한다. 예컨대 관리자가 보기에는 예약이 저조해서 가격을 낮춰야 하는데 추천은 오히려 인상을 권한다면, 관리자는 추천을 따르지 않고 자신의 판단대로 가격을 내린다. 그 결과 직접 입력 사례에는 추천과 반대되는 정보를 지닌 경우가 체계적으로 더 많이 포함되며, 이 때문에 관측된 전가율은 실제 편향보다 낮게 나타난다. 이처럼 특정 조건에서 관찰된 표본이 전체를 대표하지 못하는 현상을 ‘부정적 선택(negative selection)’이라 부른다. 이 왜곡을 고려하지 않고 추천이 실제보다 얼마나 부풀려졌는지를 계산하면 1.39배라는 값이 나오지만, 뒤에서 소개할 모형으로 이를 보정하면 앞서 언급한 약 1.2배라는 값을 얻는다.
관리자의 행동에는 이런 식의 조언 모형으로는 설명되지 않는 특징도 하나 있다. 치프토크와 같은 기존 조언 모형에서는 조언이 극단적일수록, 즉 변화 폭이 클수록 오히려 그 조언을 받아들일 가능성이 낮아진다고 본다. 상대가 지나치게 큰 변화를 요구하면 그 말의 신뢰도가 떨어진다고 보는 것이 자연스럽기 때문이다. 그런데 이 논문이 분석한 호텔 데이터에서는 정반대의 패턴이 나타난다. 추천의 변동 폭이 클수록 관리자가 추천을 그대로 복사할 확률이 오히려 높아지는 것이다. 이는 다음과 같이 두 단계로 구분된 비용 구조로 설명된다.
| 단계 | 관리자의 선택 | 비용 | 결과 |
|---|---|---|---|
| 0단계 | 개입하지 않는다 | 없음 | 기존 가격 유지 |
| 1단계 | 가격 화면에 주의를 기울인다 | 주의비용 | 즉시 떠오르는 현장 정보를 확보 |
| 2단계 | 최적 가격을 직접 산출한다 | 사고비용 | 추가 정보를 확보하고 가격을 자유롭게 설정 |
변동 폭이 크다는 것은 사안의 중요성을 시사하므로 관리자는 그런 경우에 한해 주의를 기울인다. 그러나 주의를 기울였다고 해서 최적 가격을 스스로 산출할 수 있는 것은 아니며, 그 산출에는 별도의 사고비용이 요구된다. 다수의 관리자가 1단계에서 멈추고 추천을 수용하는 이유다. 실제 가격 결정 화면도 이 비용 구조와 맞아떨어진다. 추천을 수락하는 데는 클릭 한 번이면 충분하지만, 직접 가격을 입력하려면 다른 화면으로 넘어가 값을 하나하나 채워 넣어야 한다.
✔️ 데이터 및 방법론
데이터는 유럽에 기반을 둔 익명의 수익관리 서비스 기업이 제공했다. 이 기업의 고객 가운데 아홉 곳의 기록이 분석에 사용되었으며, 이 중 여덟 곳은 휴양지에, 한 곳은 도심에 위치한다. 호텔당 관측 기간은 약 14개월이고, 규모는 약 600만 건의 일별 가격 정보와 약 6만 건의 예약이다. 관측 단위는 객실 유형과 도착일의 조합, 즉 특정 객실을 특정 날짜에 판매하는 상품 하나다.
분석 대상 호텔은 객실 수 50개 안팎으로 관리자가 여러 업무를 겸하는 가족 경영 형태이며, 가격 관리를 전담하는 인력이 없다. 이 논문에서 조정비용이 크게 관측되는 데는 이런 배경이 작용했을 가능성이 크며, 전담 조직을 갖춘 대형 체인이라면 결과가 달라질 수 있다.
표본에는 한 가지 제약이 적용되었다. 분석에 사용된 주 표본은 직전 가격이 추천 가격과 일치했던 관측치로 한정된다(N = 2,017,932, 전체의 약 34%). 이렇게 표본을 한정하면 추천과 실제 가격의 차이를 해당 시점의 정보 처리 차이로 해석할 수 있다. 아울러 관리자가 과거에 직접 입력한 가격이 이후의 추천에까지 영향을 미치는 피드백 효과(feedback effect), 즉 과거의 결정이 다시 다음 추천의 형성에 관여하는 순환적 영향도 함께 배제할 수 있다. 가격 변화는 비율로 측정하기 위해 매일의 가격을 로그 값으로 바꾸고 전날과 비교했으며, 이 값이 달라진 경우를 가격 갱신으로 정의했다.
데이터에서 관측된 네 가지 사실
모형을 제시하기에 앞서 데이터에서 나타나는 다음 규칙성이 먼저 정리된다.
관리자의 가격 갱신은 알고리즘의 추천 갱신보다 훨씬 드물다. 알고리즘은 평균 7일마다 추천을 바꾸지만 관리자는 평균 35일에 한 번 가격을 바꾼다. 추천의 변동 폭이 클수록 관리자가 실제로 가격을 갱신할 확률도 높아지는데, 추천이 전혀 바뀌지 않은 경우 갱신 확률은 0.6%에 그치지만 추천이 10% 넘게 변동한 경우에는 14.3%까지 오른다. 같은 논리는 복사 여부에도 적용된다. 추천의 변동 폭이 클수록 관리자가 그 추천을 그대로 복사할 확률도 높아져서, 전체 평균으로는 84.0%인 복사 확률이 10% 넘는 변동에서는 95.0%까지 상승한다. 반면 관리자가 추천을 복사하지 않고 직접 가격을 입력하는 경우에는 추천의 변화가 실제 가격에 온전히 반영되지 않는다. 전가율은 72.5%에 그치며, 다른 조건을 통제해도 73% 수준에 머무른다.
이 가운데 변동 폭과 갱신 확률, 변동 폭과 복사 확률 사이의 관계는 같은 호텔, 같은 예약 시점, 같은 도착월 내부의 관측치만 비교해도 그대로 유지된다. 계절이나 개별 호텔의 특성이 만들어 낸 우연한 상관이 아니라는 뜻이다.
모형과 추정 방법
논문의 모형에서 관리자가 입는 손실은 실제 가격과 최적 가격이 벌어진 정도에 비례한다. 이때 최적 가격은 세 종류의 정보로 구성된다. 알고리즘만이 보유한 사적 정보, 관리자가 주의비용을 들이면 즉시 확인할 수 있는 현장 정보, 그리고 사고비용을 추가로 들여야 얻을 수 있는 정보다. 관리자는 알고리즘이 가진 사적 정보를 직접 알 수 없고 오직 추천 가격을 통해서만 간접적으로 짐작한다. 하지만 앞서 살펴본 대로 알고리즘은 이 정보를 있는 그대로 전달하지 않고 일정한 비율만큼 부풀려서 전달한다. 논문에서 언급되는 ‘균형(equilibrium)’이란 알고리즘이 실제로 부풀리는 정도와 관리자가 예상하는 과장의 정도가 정확히 일치하는 상태를 말한다. 관리자가 추천을 얼마나 할인해서 받아들여야 할지를 정확히 알고 있다고 가정하는 것이 이 균형의 의미다.
이러한 모형을 실제 자료에 적용하려면 몇 가지 값을 추정해야 한다. 과장의 정도, 세 가지 정보가 최적 가격에서 차지하는 비중, 그리고 가격 결정에 드는 비용이 상황마다 얼마나 들쭉날쭉한지를 나타내는 값들이다. 이 값들은 모의적률법(SMM, Method of Simulated Moments)으로 추정되었다. 모형을 컴퓨터로 반복 시뮬레이션한 뒤, 그 결과가 실제 자료에서 관찰되는 값들과 최대한 가까워지도록 위 값들을 조정해 나가는 방식이다. 비교 기준으로 삼은 값은 가격을 갱신할 때의 가격과 추천의 흩어진 정도, 둘 사이의 관계, 추천을 그대로 복사하는 비율, 평균 갱신률 등 일곱 가지다. 이 추정 과정에는 추정된 과장의 정도가 알고리즘에게 실제로 최선의 선택이어야 한다는 조건이 붙는다. 이 조건을 만족하는 값을 찾을 때까지 추정을 반복함으로써 관측된 과장이 우연이 아니라 알고리즘이 의도적으로 선택한 결과임을 확인할 수 있다.
✔️ 연구 결과
추천 편향의 크기
전체 호텔을 통합해 추정한 결과, 편향 계수는 0.83으로 나타났다. 이는 알고리즘의 추천이 실제 최적 가격 변화보다 약 1.2배 부풀려져 있다는 뜻이며, 편향이 전혀 없는 경우와는 통계적으로 유의하게 구별된다. 호텔별로 나누어 보면 이 값은 0.60에서 0.93까지 폭넓게 분포하는데, 이러한 편차는 알고리즘이 해당 호텔에 대해 보유한 정보의 양, 그리고 관리자가 가격을 좀처럼 바꾸지 않으려는 성향, 즉 관성의 정도에서 비롯된다. 관성이 강한 관리자를 상대할수록 알고리즘은 추천을 더 크게 부풀리는 경향을 보인다.
정보의 분포
알고리즘이 보유한 사적 정보는 최적 가격 전체 변동의 20~30%만을 설명한다. 나머지는 관리자만이 파악할 수 있는 현장 정보이며, 가치만 놓고 보면 관리자가 지닌 정보가 알고리즘의 정보보다 다섯 배 이상 크다. 문제는 그 정보를 확인하고 반영하는 데 주의비용과 사고비용이 든다는 점이다. 그 결과 실제 가격의 표준편차는 최적 가격과 실제 가격의 차이가 보이는 표준편차보다 오히려 작게 나타난다. 최적 가격이 오르내리는 폭의 상당 부분이 실제 가격에는 반영되지 않는다는 뜻이다.
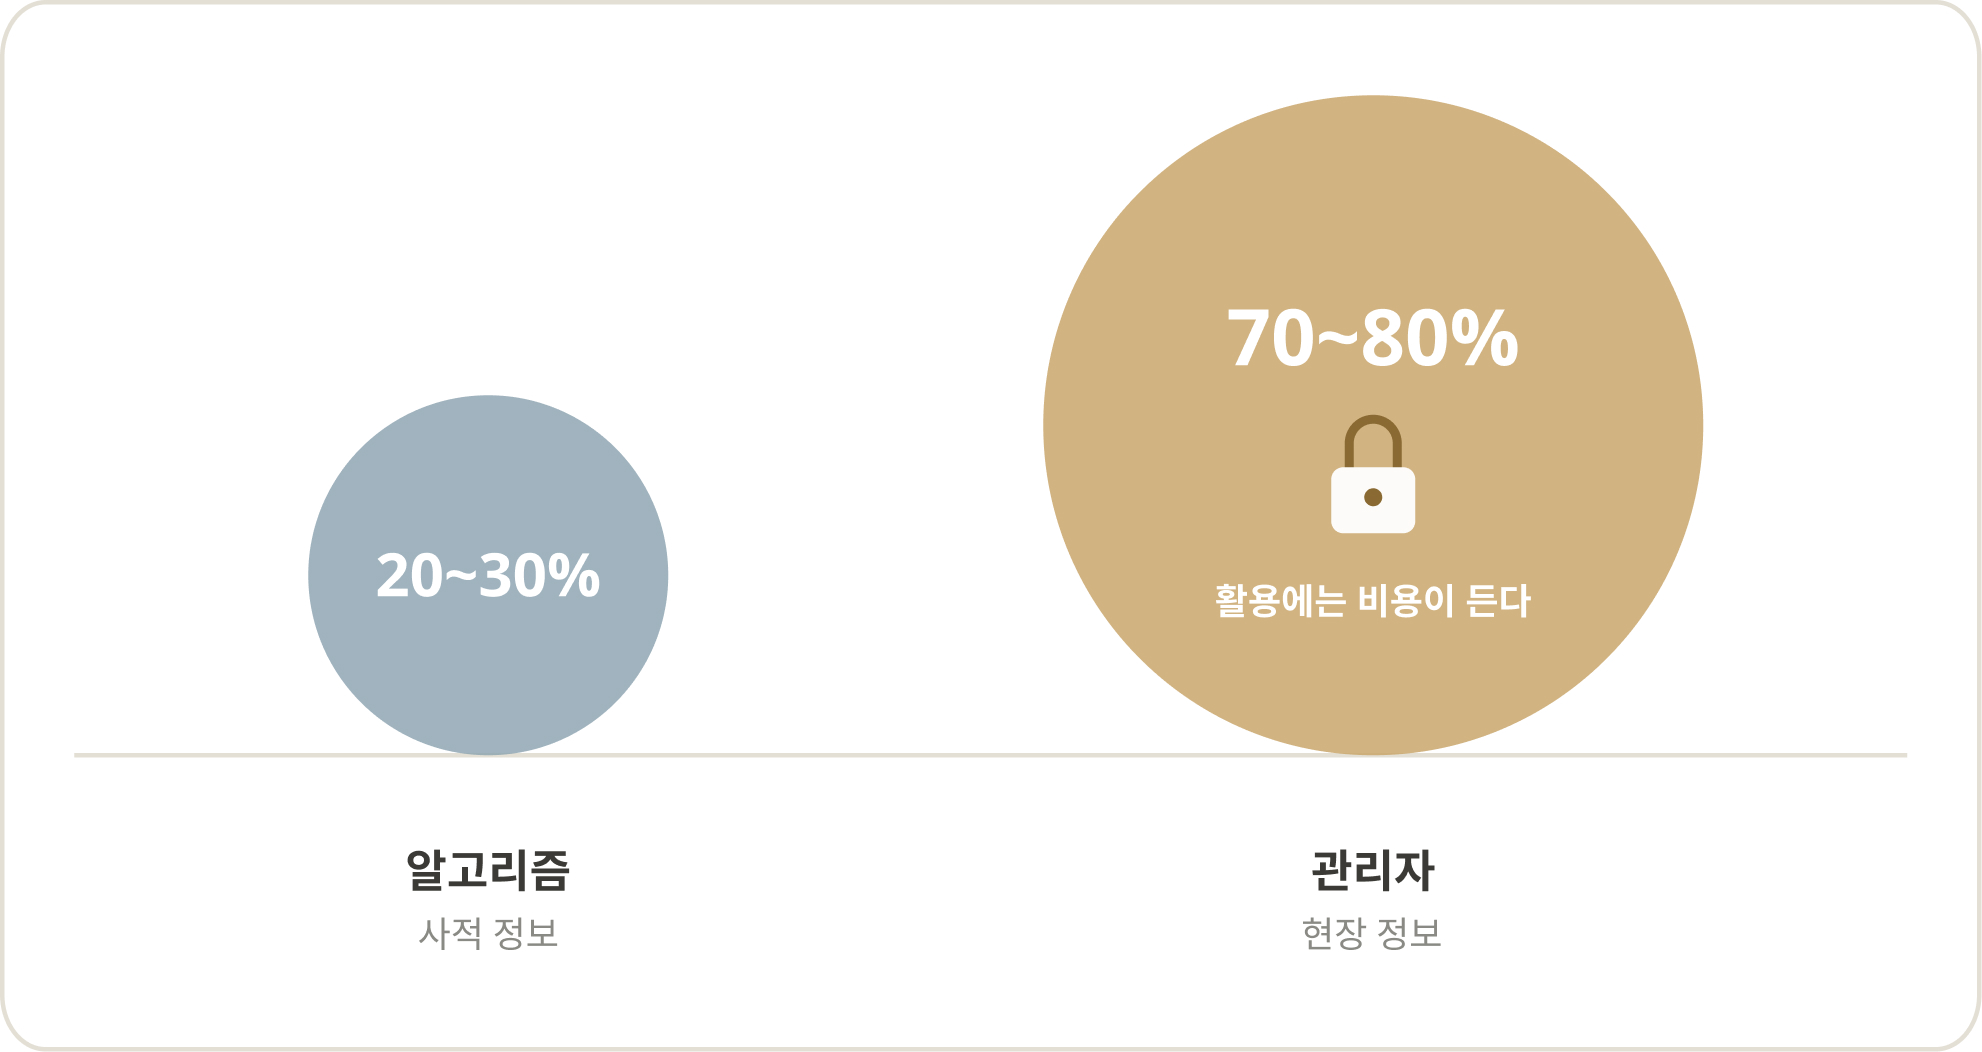
그림 2. 알고리즘과 관리자가 보유한 정보의 비중. 최적 가격의 변동을 설명하는 정보 가운데 알고리즘의 사적 정보는 20~30%에 그치고, 나머지는 관리자만이 파악할 수 있는 현장 정보다. 그러나 이 정보는 확인하고 반영하는 데 비용이 든다.
위임의 효과
추정된 모형은 여러 시나리오에서 발생하는 손실의 크기를 계산하는 데도 쓰인다. 비교 기준은 관리자가 가격을 한 번도 바꾸지 않는 완전 무행동 상태이며, 이때의 손실을 1로 놓고 다른 시나리오의 손실을 그 대비 비율로 나타낸다. 값이 작을수록 효율적인 결과다. 완전 위임은 가격 결정 권한 자체를 알고리즘으로 넘기는 경우를 말하며, 이 경우 관리자가 치르는 조정비용도 함께 사라진다.
| 시나리오 | 설명 | 손실 (9개 호텔 범위) |
|---|---|---|
| 현행 체제 | 관리자가 추천을 검토한 뒤 가격을 결정하는 지금의 방식. 조정비용까지 포함해 계산한다. |
0.984 ~ 0.998 |
| 현행 체제 (조정비용 제외) |
위와 같은 방식이지만 관리자가 가격 확인과 판단에 들이는 조정비용은 계산에서 제외한다. |
0.967 ~ 0.991 |
| 완전 위임 | 가격 결정 권한을 알고리즘에 완전히 넘기고 알고리즘은 과장 없이 정확한 가격을 제시한다. |
0.643 ~ 0.961 |
| 편향 유지 위임 | 가격 결정 권한은 알고리즘에 넘기되 알고리즘이 추천을 부풀린 상태를 그대로 유지한다. |
0.673 ~ 0.961 |
| 추천 없음 | 관리자가 알고리즘의 추천을 아예 제공받지 못하고 스스로 가격을 결정한다. |
0.996 ~ 1.000 |
현행 체제가 완전 무행동보다 나은 정도는 1~3%에 불과하며, 조정비용까지 반영하면 그 폭은 더 축소된다. 반면 완전 위임은 손실을 4~36% 감소시킨다. 주목할 부분은 표의 셋째 행과 넷째 행의 차이가 크지 않다는 점이다. 알고리즘이 과장을 그대로 유지한 채 가격을 결정하더라도 결과는 완전 위임과 거의 다르지 않다. 이는 편향 자체가 손실의 주된 원인이 아님을 시사한다. 실제로 위임에서 얻는 이득을 나누어 보면 약 80%는 가격을 더 자주 조정하는 데서, 10%는 편향이 제거되는 데서, 나머지 10%는 정보를 처리하는 비용이 사라지는 데서 발생한다. 다섯째 행도 같은 방향을 가리킨다. 추천을 아예 제공받지 못하는 경우의 손실이 완전 무행동과 거의 동일하다는 것은, 관리자가 스스로 가격을 조정하는 일이 그만큼 드물다는 뜻이다.
✔️ 결론
이 연구가 보여 주는 것은 세 단계로 이어지는 하나의 연쇄다. 사람은 결정을 바꾸는 데 비용을 치르므로 좀처럼 개입하지 않고, 알고리즘은 그러한 관성을 전제로 조언을 부풀리며, 사람은 다시 그 과장을 예상하고 조언을 할인해서 받아들인다. 흥미로운 점은 양측이 서로의 행동을 정확히 예측하고 있음에도 실현되는 가격은 최적에서 계속 벗어난다는 것이다. 더 흥미로운 점은 이 왜곡에 어느 쪽의 과실도 없다는 사실이다. 목표는 일치하고, 자료에는 편향이 없으며, 관리자도 비합리적으로 행동하지 않는다. 그럼에도 조정비용이라는 비대칭 하나만으로 왜곡이 성립하며, 이는 알고리즘과 사람이 함께 일하는 구조라면 어디서든 재현될 수 있는 조건이다.
이로부터 고려해 볼 만한 것은 사람의 개입을 남겨 두는 일 자체가 통제 장치는 아니라는 것이다. 이 논문에서 관리자는 알고리즘보다 다섯 배 이상 가치 있는 정보를 지니고 있었지만 그 정보는 대부분 쓰이지 않았고, 이는 사람의 판단을 시스템 안에 실질적으로 남겨 두려면 판단의 권한이 아니라 판단에 드는 비용을 설계의 대상으로 삼아야 한다는 것을 말해 준다. 같은 맥락에서, 현재 상태를 유지하는 선택지가 존재한다는 사실 자체가 조언하는 쪽의 유인 구조를 바꾼다는 점도 확인된다. 의사의 진단 보조 시스템이나 가석방 심사 보조 시스템(Berk, 2017)처럼 현 상태 유지가 클릭 한 번으로 가능하고 이탈에는 별도의 노력이 요구되는 환경이라면 어디서든 같은 이해충돌이 성립할 수 있다. 이 결과는 객실 수 50개 안팎의 가족 경영 호텔 아홉 곳에서 얻어졌으므로, 전담 조직을 갖춘 대형 체인에 그대로 적용될지는 조정비용의 크기에 달려 있을 것이다.
이 논문의 가치는 호텔 가격이라는 특정한 배경을 넘어선다. 알고리즘과 사람이 함께 일하는 구조를 설계할 때 흔히 전제되는 원칙은, 최종 결정권을 사람에게 남겨 두기만 하면 알고리즘의 오류를 걸러낼 수 있다는 것이었다. 이 연구는 그 전제를 정면으로 검증한다. 사람에게 결정권이 있다는 사실과 그 결정권이 실제로 행사된다는 사실은 전혀 다른 문제이며, 조정비용이 존재하는 한 결정권은 명목으로만 남고 알고리즘이 사실상 결정을 대신하게 된다는 것을 데이터로 보여 준다. 나아가 이 결과는 알고리즘의 조언이 편향되어 있다는 사실 자체보다 그 편향이 어디에서 비롯되었는지를 묻는 일이 더 중요할 수 있음을 시사한다. 조언이 왜곡되었다면 그 원인이 나쁜 데이터에 있는지, 알고리즘에 대한 사람의 불신에 있는지, 혹은 이 논문이 짚어낸 것처럼 결정을 바꾸는 데 드는 비용의 격차에 있는지에 따라 처방은 달라진다. 데이터에 아무런 흠이 없고 관리자도 합리적으로 행동하는 상황에서조차 조언이 체계적으로 왜곡될 수 있다는 사실을 보인 것은, 사람이 알고리즘의 감시자 역할을 하기를 기대하는 모든 구조에 던지는 경고에 가깝다. 사람이 결정을 내리는 자리에 앉아 있다는 것만으로는 아무것도 보장되지 않으며, 그 자리에 실제로 개입할 만한 여건을 만들어 주는 일까지가 설계의 몫이라는 것이 이 논문이 남기는 결론이다.
📎 참고자료
- Crawford, V. P., & Sobel, J. (1982). Strategic information transmission. Econometrica, 50(6), 1431–1451. doi.org/10.2307/1913390 — 「연구 내용 및 논리」에서 언급한 치프토크 모형. 선호가 일치하는 이 논문의 설정과 대비되는 표준적 틀로 인용했다.
- Dietvorst, B. J., Simmons, J. P., & Massey, C. (2015). Algorithm aversion: People erroneously avoid algorithms after seeing them err. Journal of Experimental Psychology: General, 144(1), 114–126. doi.org/10.1037/xge0000033 — 「소개 및 요약」에서 언급한 알고리즘 혐오 개념의 출처.
- Berk, R. (2017). An impact assessment of machine learning risk forecasts on parole board decisions and recidivism. Journal of Experimental Criminology, 13(2), 193–216. doi.org/10.1007/s11292-017-9286-2 — 「결론」에서 동일한 구조가 나타날 수 있는 영역으로 언급한 가석방 심사 보조 시스템 사례.
- U.S. Department of Justice. (2024, August 23). Justice Department sues RealPage for algorithmic pricing scheme that harms millions of American renters [Press release]. justice.gov — 「소개 및 요약」에서 언급한 임대료 산정 소프트웨어 사례 중 자동 수락 기능과 추천 준수 여부 점검에 관한 서술의 출처.
- U.S. Department of Justice, Antitrust Division. (2025, May 14). United States et al. v. RealPage, Inc., et al.: Competitive impact statement. Federal Register, 90(92), 20505. govinfo.gov — 같은 사례 중 수락과 이탈에 요구되는 절차의 비대칭 및 최종 임대료의 85% 이상이 추천 가격의 5% 이내에서 결정되었다는 서술의 출처.